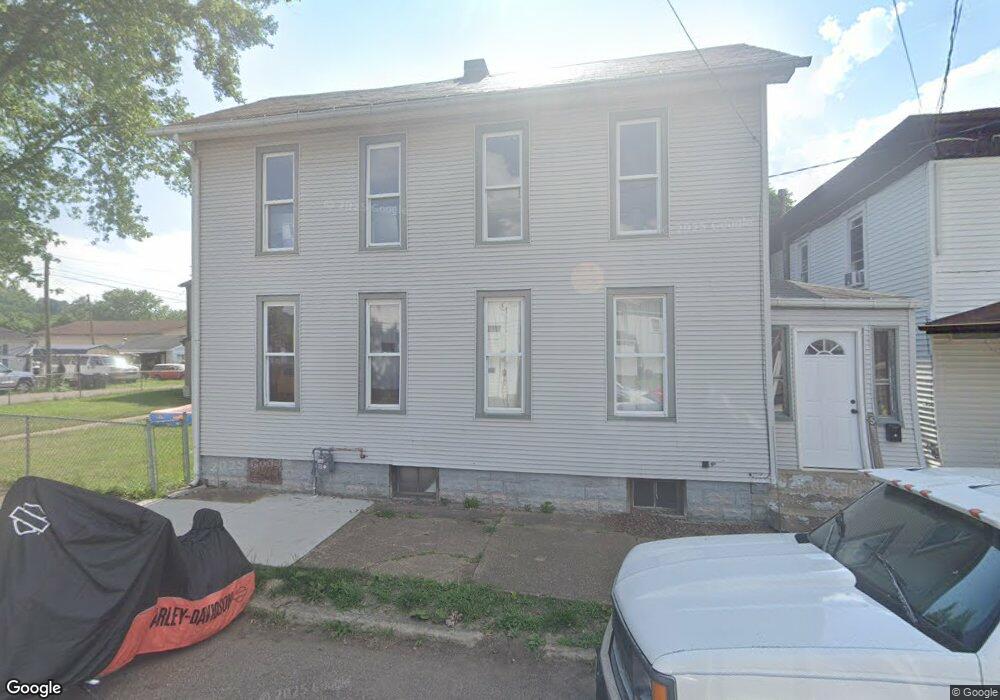
5 S 3rd St Dennison, OH 44621
Estimated Value: $91,000 - $147,000
3
Beds
1
Bath
1,320
Sq Ft
$83/Sq Ft
Est. Value
About This Home
This home is located at 5 S 3rd St, Dennison, OH 44621 and is currently estimated at $109,656, approximately $83 per square foot. 5 S 3rd St is a home located in Tuscarawas County with nearby schools including Claymont High School and Immaculate Conception School.
Ownership History
Date
Name
Owned For
Owner Type
Purchase Details
Closed on
Nov 5, 2025
Sold by
Oconnell James D and Oconnell Stephanie E
Bought by
Green Lisa
Current Estimated Value
Purchase Details
Closed on
Apr 20, 2006
Sold by
Advantage Bank
Bought by
Oconnell James D and Oconnell Stephanie E
Home Financials for this Owner
Home Financials are based on the most recent Mortgage that was taken out on this home.
Original Mortgage
$246,000
Interest Rate
6.12%
Mortgage Type
Purchase Money Mortgage
Purchase Details
Closed on
May 5, 2005
Sold by
Frye Kippton R
Bought by
Advantage Bank
Purchase Details
Closed on
May 7, 1999
Sold by
Goedel Barbara A
Bought by
Fute Kippton R
Purchase Details
Closed on
Oct 1, 1990
Bought by
Goedel David W and Goedel Barbara A
Purchase Details
Closed on
Apr 25, 1990
Sold by
Enochs Marvin L and Enochs Iona R
Bought by
O'Connell James D and O'Connell Stephanie E
Create a Home Valuation Report for This Property
The Home Valuation Report is an in-depth analysis detailing your home's value as well as a comparison with similar homes in the area
Home Values in the Area
Average Home Value in this Area
Purchase History
| Date | Buyer | Sale Price | Title Company |
|---|---|---|---|
| Green Lisa | -- | None Listed On Document | |
| Oconnell James D | $226,000 | None Available | |
| Advantage Bank | $30,000 | Camco Title | |
| Fute Kippton R | $27,000 | -- | |
| Goedel David W | $16,000 | -- | |
| O'Connell James D | $25,500 | -- |
Source: Public Records
Mortgage History
| Date | Status | Borrower | Loan Amount |
|---|---|---|---|
| Previous Owner | Oconnell James D | $246,000 |
Source: Public Records
Tax History
| Year | Tax Paid | Tax Assessment Tax Assessment Total Assessment is a certain percentage of the fair market value that is determined by local assessors to be the total taxable value of land and additions on the property. | Land | Improvement |
|---|---|---|---|---|
| 2024 | $804 | $21,580 | $1,640 | $19,940 |
| 2023 | $804 | $61,660 | $4,680 | $56,980 |
| 2022 | $809 | $21,581 | $1,638 | $19,943 |
| 2021 | $740 | $18,393 | $1,061 | $17,332 |
| 2020 | $793 | $18,393 | $1,061 | $17,332 |
| 2019 | $724 | $18,393 | $1,061 | $17,332 |
| 2018 | $365 | $15,520 | $890 | $14,630 |
| 2017 | $677 | $15,520 | $890 | $14,630 |
| 2016 | $673 | $15,520 | $890 | $14,630 |
| 2014 | $681 | $15,560 | $850 | $14,710 |
| 2013 | $687 | $15,560 | $850 | $14,710 |
Source: Public Records
Map
Nearby Homes
Your Personal Tour Guide
Ask me questions while you tour the home.