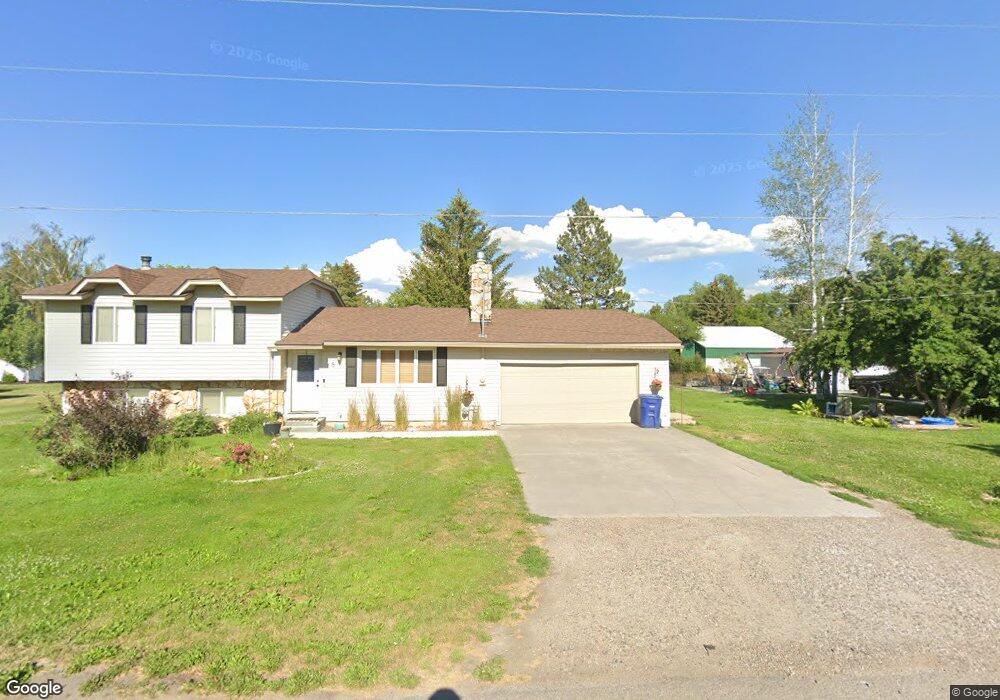
5 S 645 W Blackfoot, ID 83221
Estimated Value: $347,171 - $422,000
4
Beds
2
Baths
1,436
Sq Ft
$262/Sq Ft
Est. Value
About This Home
This home is located at 5 S 645 W, Blackfoot, ID 83221 and is currently estimated at $376,793, approximately $262 per square foot. 5 S 645 W is a home with nearby schools including Riverside Elementary School, Moreland Elementary School, and Rockford Elementary School.
Ownership History
Date
Name
Owned For
Owner Type
Purchase Details
Closed on
Jun 6, 2019
Sold by
Albertson Vivian J and Albertson Vivian Janeil
Bought by
Waters Aaron Tanner and Waters Brittany Lynn
Current Estimated Value
Home Financials for this Owner
Home Financials are based on the most recent Mortgage that was taken out on this home.
Original Mortgage
$213,750
Outstanding Balance
$140,612
Interest Rate
4.2%
Mortgage Type
New Conventional
Estimated Equity
$236,181
Purchase Details
Closed on
Jan 25, 2011
Sold by
Larson Sandra and Rooks Sandra
Bought by
Albertson Floyd G and Albertson Vivian J
Create a Home Valuation Report for This Property
The Home Valuation Report is an in-depth analysis detailing your home's value as well as a comparison with similar homes in the area
Home Values in the Area
Average Home Value in this Area
Purchase History
| Date | Buyer | Sale Price | Title Company |
|---|---|---|---|
| Waters Aaron Tanner | -- | First American Title Blackfo | |
| Albertson Floyd G | -- | -- |
Source: Public Records
Mortgage History
| Date | Status | Borrower | Loan Amount |
|---|---|---|---|
| Open | Waters Aaron Tanner | $213,750 |
Source: Public Records
Tax History Compared to Growth
Tax History
| Year | Tax Paid | Tax Assessment Tax Assessment Total Assessment is a certain percentage of the fair market value that is determined by local assessors to be the total taxable value of land and additions on the property. | Land | Improvement |
|---|---|---|---|---|
| 2025 | $1,028 | $328,814 | $50,000 | $278,814 |
| 2024 | $1,028 | $315,814 | $37,000 | $278,814 |
| 2023 | $1,222 | $315,814 | $37,000 | $278,814 |
| 2022 | $1,702 | $240,903 | $37,000 | $203,903 |
| 2021 | $1,276 | $209,495 | $32,000 | $177,495 |
| 2020 | $1,201 | $178,716 | $0 | $0 |
| 2019 | $1,315 | $178,716 | $0 | $0 |
| 2018 | $1,158 | $144,640 | $21,500 | $123,140 |
| 2017 | $1,148 | $139,840 | $16,700 | $123,140 |
| 2016 | $1,142 | $139,840 | $0 | $0 |
| 2015 | -- | $139,840 | $0 | $0 |
| 2014 | -- | $139,840 | $16,700 | $123,140 |
Source: Public Records
Map
Nearby Homes