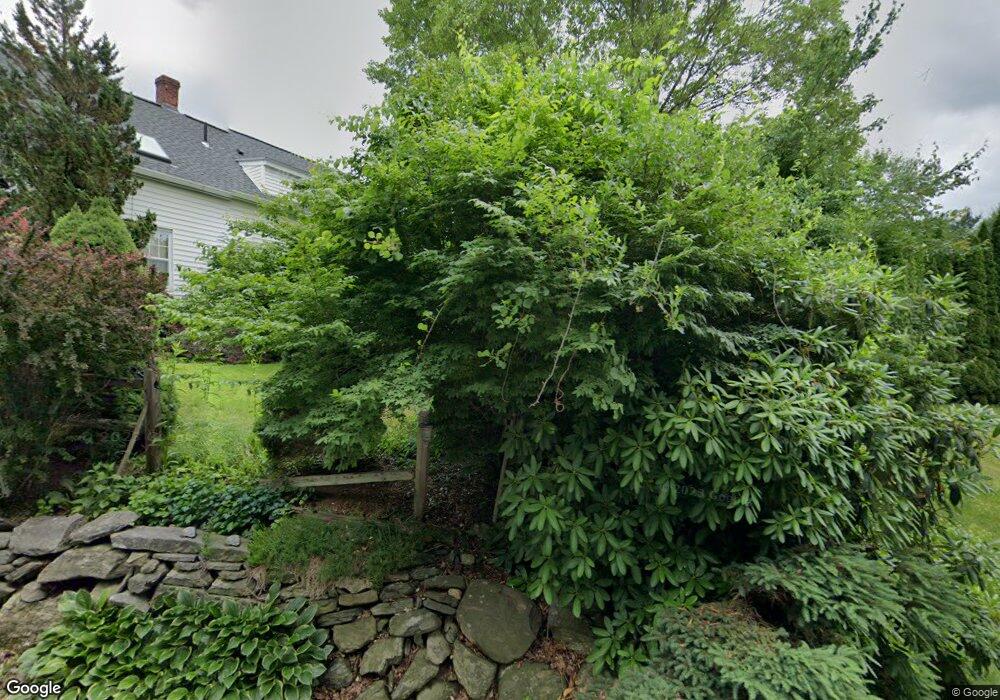
5 S Oxford Rd Millbury, MA 01527
Estimated Value: $402,933 - $513,000
2
Beds
2
Baths
1,267
Sq Ft
$344/Sq Ft
Est. Value
About This Home
This home is located at 5 S Oxford Rd, Millbury, MA 01527 and is currently estimated at $435,233, approximately $343 per square foot. 5 S Oxford Rd is a home located in Worcester County with nearby schools including Elmwood Street Elementary School, Raymond E. Shaw Elementary School, and Millbury Junior/Senior High School.
Ownership History
Date
Name
Owned For
Owner Type
Purchase Details
Closed on
Jan 29, 1998
Sold by
Boatwright Margaret M and Cobat Scott A
Bought by
Cobat Scott A
Current Estimated Value
Home Financials for this Owner
Home Financials are based on the most recent Mortgage that was taken out on this home.
Original Mortgage
$99,000
Outstanding Balance
$17,557
Interest Rate
7.02%
Mortgage Type
Purchase Money Mortgage
Estimated Equity
$417,676
Purchase Details
Closed on
Feb 2, 1993
Sold by
Corsi Richard J and Corsi Diane
Bought by
Cobat Scott A and Boatwright Margaret
Home Financials for this Owner
Home Financials are based on the most recent Mortgage that was taken out on this home.
Original Mortgage
$93,200
Interest Rate
8.16%
Mortgage Type
Purchase Money Mortgage
Create a Home Valuation Report for This Property
The Home Valuation Report is an in-depth analysis detailing your home's value as well as a comparison with similar homes in the area
Home Values in the Area
Average Home Value in this Area
Purchase History
| Date | Buyer | Sale Price | Title Company |
|---|---|---|---|
| Cobat Scott A | $7,000 | -- | |
| Cobat Scott A | $7,000 | -- | |
| Cobat Scott A | $116,500 | -- | |
| Cobat Scott A | $116,500 | -- |
Source: Public Records
Mortgage History
| Date | Status | Borrower | Loan Amount |
|---|---|---|---|
| Open | Cobat Scott A | $99,000 | |
| Closed | Cobat Scott A | $99,000 | |
| Previous Owner | Cobat Scott A | $93,200 |
Source: Public Records
Tax History Compared to Growth
Tax History
| Year | Tax Paid | Tax Assessment Tax Assessment Total Assessment is a certain percentage of the fair market value that is determined by local assessors to be the total taxable value of land and additions on the property. | Land | Improvement |
|---|---|---|---|---|
| 2025 | $4,357 | $325,400 | $110,800 | $214,600 |
| 2024 | $4,015 | $303,500 | $102,600 | $200,900 |
| 2023 | $3,669 | $253,900 | $72,000 | $181,900 |
| 2022 | $3,537 | $235,800 | $72,000 | $163,800 |
| 2021 | $3,546 | $229,800 | $72,000 | $157,800 |
| 2020 | $16,124 | $221,400 | $72,000 | $149,400 |
| 2019 | $15,670 | $223,900 | $65,400 | $158,500 |
| 2018 | $151 | $197,900 | $65,400 | $132,500 |
| 2017 | $151 | $188,500 | $65,400 | $123,100 |
| 2016 | $14,948 | $178,800 | $65,400 | $113,400 |
| 2015 | $2,935 | $178,300 | $69,500 | $108,800 |
| 2014 | $2,733 | $159,800 | $69,500 | $90,300 |
Source: Public Records
Map
Nearby Homes