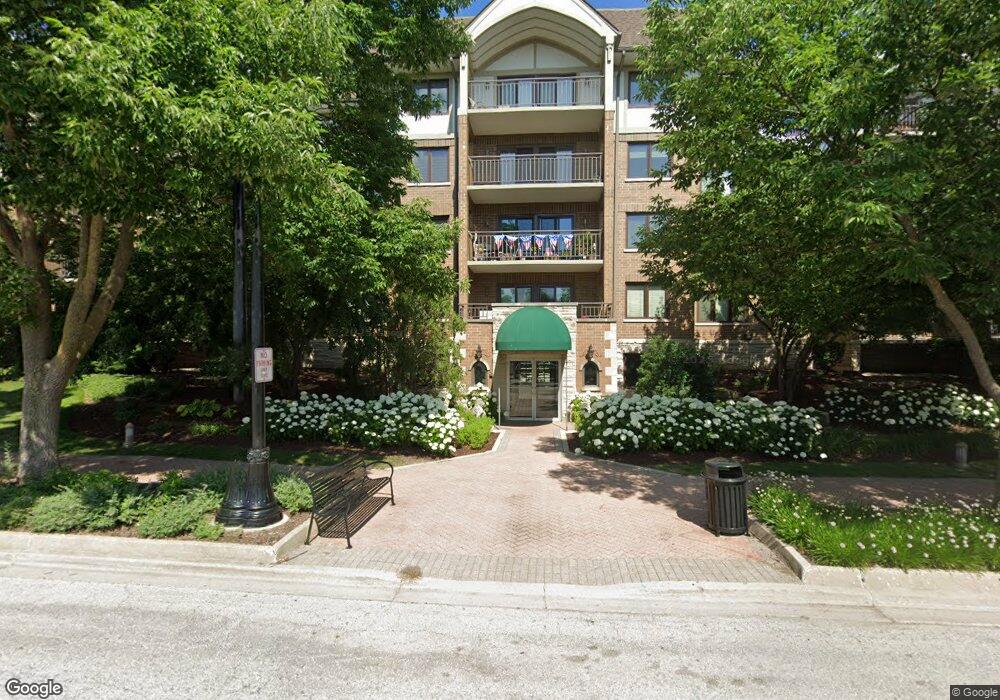
Clocktower Condominiums 5 S Pine St Unit 404B Mount Prospect, IL 60056
Downtown Mount Prospect NeighborhoodEstimated Value: $384,000 - $409,741
3
Beds
2
Baths
1,756
Sq Ft
$228/Sq Ft
Est. Value
About This Home
This home is located at 5 S Pine St Unit 404B, Mount Prospect, IL 60056 and is currently estimated at $400,685, approximately $228 per square foot. 5 S Pine St Unit 404B is a home located in Cook County with nearby schools including Fairview Elementary School, Lincoln Middle School, and Prospect High School.
Ownership History
Date
Name
Owned For
Owner Type
Purchase Details
Closed on
Jan 13, 2026
Sold by
Byrne Nora
Bought by
Nora A Byrne Trust and Byrne
Current Estimated Value
Purchase Details
Closed on
Nov 5, 2024
Sold by
Anita L Austin Revocable Trust and Austin Anita L
Bought by
Byrne Nora
Purchase Details
Closed on
Aug 20, 2020
Sold by
Austin Anita L
Bought by
Austin Anita L and Anita L Austin Revocable Trust
Purchase Details
Closed on
Feb 5, 2019
Sold by
Swartzentruber Calvin D and Swartzentruber Michelle
Bought by
Austin Anita L
Purchase Details
Closed on
Nov 28, 2001
Sold by
Kratzmeyer John J and Kratzmeyer Nicolina A
Bought by
Swartzentruber Calvin D and Swartzentruber Michelle
Home Financials for this Owner
Home Financials are based on the most recent Mortgage that was taken out on this home.
Original Mortgage
$188,000
Interest Rate
6.64%
Purchase Details
Closed on
Aug 2, 1996
Sold by
Parkway Bank & Trust Company
Bought by
Kratzmeyer John J and Kratzmeyer Nicolina A
Create a Home Valuation Report for This Property
The Home Valuation Report is an in-depth analysis detailing your home's value as well as a comparison with similar homes in the area
Home Values in the Area
Average Home Value in this Area
Purchase History
| Date | Buyer | Sale Price | Title Company |
|---|---|---|---|
| Nora A Byrne Trust | -- | None Listed On Document | |
| Byrne Nora | $430,000 | None Listed On Document | |
| Byrne Nora | $430,000 | None Listed On Document | |
| Austin Anita L | -- | Attorneys Ttl Guaranty Fund | |
| Austin Anita L | $262,000 | Chicago Title Insurance Co | |
| Swartzentruber Calvin D | $235,000 | -- | |
| Kratzmeyer John J | $198,500 | -- |
Source: Public Records
Mortgage History
| Date | Status | Borrower | Loan Amount |
|---|---|---|---|
| Previous Owner | Swartzentruber Calvin D | $188,000 |
Source: Public Records
Tax History
| Year | Tax Paid | Tax Assessment Tax Assessment Total Assessment is a certain percentage of the fair market value that is determined by local assessors to be the total taxable value of land and additions on the property. | Land | Improvement |
|---|---|---|---|---|
| 2025 | $7,009 | $36,508 | $1,254 | $35,254 |
| 2024 | $7,009 | $25,165 | $1,036 | $24,129 |
| 2023 | $6,740 | $25,165 | $1,036 | $24,129 |
| 2022 | $6,740 | $25,165 | $1,036 | $24,129 |
| 2021 | $6,996 | $22,451 | $653 | $21,798 |
| 2020 | $6,850 | $22,451 | $653 | $21,798 |
| 2019 | $5,917 | $25,004 | $653 | $24,351 |
| 2018 | $4,629 | $18,566 | $544 | $18,022 |
| 2017 | $4,660 | $18,566 | $544 | $18,022 |
| 2016 | $4,269 | $18,566 | $544 | $18,022 |
| 2015 | $4,320 | $17,487 | $490 | $16,997 |
| 2014 | $4,263 | $17,487 | $490 | $16,997 |
| 2013 | $4,242 | $17,487 | $490 | $16,997 |
Source: Public Records
About Clocktower Condominiums
Map
Nearby Homes
- 10 S Wille St Unit 603
- 10 S Wille St Unit 201
- 5 S Pine St Unit 506B
- 100 S Emerson St Unit E507
- 17 S Maple St
- 114 S Elm St
- 6 S Wa Pella Ave
- 220 University Dr Unit 35
- 605 W Central Rd Unit C1
- 607 W Central Rd Unit A4
- 215 N Main St
- 308 S I Oka Ave
- 219 Village Dr Unit 29
- 703 W Central Rd Unit 1C8
- 210 S Wa Pella Ave
- 447 S Elmhurst Rd
- 502 S I Oka Ave
- 507 S I Oka Ave
- 320 N Prospect Manor Ave
- 103 N Louis St
- 5 S Pine St Unit B404
- 5 S Pine St Unit 207B
- 5 S Pine St Unit 303B
- 5 S Pine St Unit 206B
- 5 S Pine St Unit 209B
- 5 S Pine St Unit 205B
- 5 S Pine St Unit 301B
- 5 S Pine St Unit 202B
- 5 S Pine St Unit 305B
- 5 S Pine St Unit 201B
- 5 S Pine St Unit 502B
- 5 S Pine St Unit 203B
- 5 S Pine St Unit 405B
- 5 S Pine St Unit 304B
- 5 S Pine St Unit 307B
- 5 S Pine St Unit 204B
- 5 S Pine St Unit 300B
- 5 S Pine St Unit 402B
- 5 S Pine St Unit 308B
- 5 S Pine St Unit 503B
Your Personal Tour Guide
Ask me questions while you tour the home.