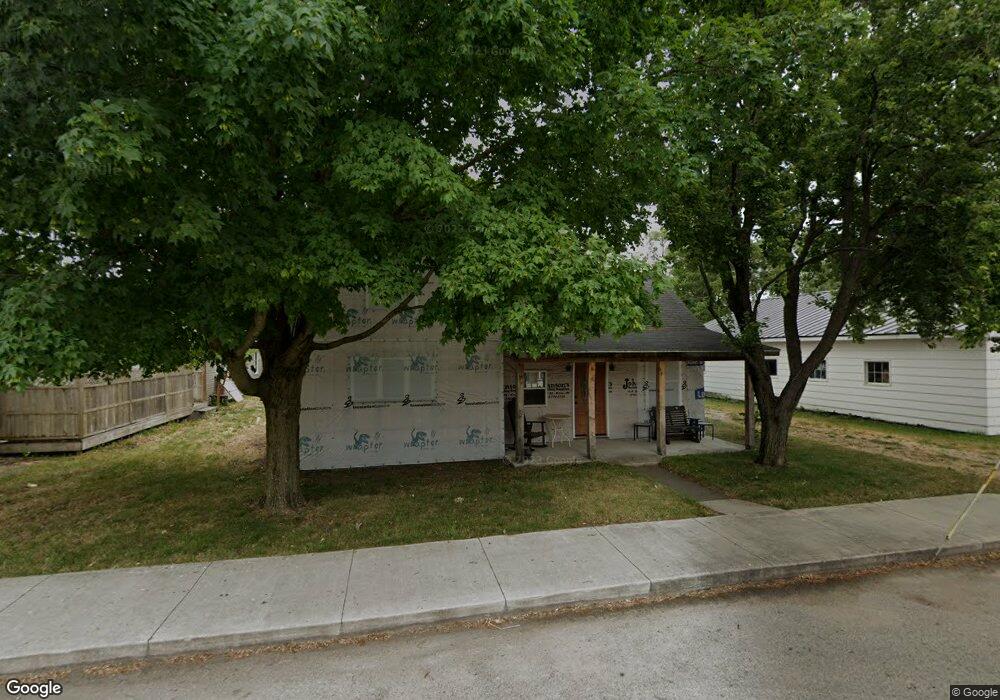
5 S Starke St Hamlet, IN 46532
Estimated Value: $53,288 - $116,000
3
Beds
1
Bath
1,232
Sq Ft
$72/Sq Ft
Est. Value
About This Home
This home is located at 5 S Starke St, Hamlet, IN 46532 and is currently estimated at $88,322, approximately $71 per square foot. 5 S Starke St is a home with nearby schools including Oregon-Davis Elementary School and Oregon-Davis Junior/Senior High School.
Ownership History
Date
Name
Owned For
Owner Type
Purchase Details
Closed on
Oct 21, 2024
Sold by
Cook Billie and Cook Joshua
Bought by
Cook Billie and Cook Joshua
Current Estimated Value
Purchase Details
Closed on
Feb 17, 2017
Sold by
Renting Spaces Llc
Bought by
Hinderer Eugene L and Hinderer Crystal A
Purchase Details
Closed on
Sep 8, 2016
Sold by
Cook Billie Jo
Bought by
Cook Joshua and Cook Billie Jo
Purchase Details
Closed on
Aug 14, 2016
Sold by
Rhineheimer Joshua Cain
Bought by
Cook Billie Jo
Purchase Details
Closed on
Aug 5, 2016
Sold by
Rhineheimer Joseph Dain
Bought by
Cook Billie Jo
Purchase Details
Closed on
Jul 22, 2016
Sold by
Rhineheimer Jamie Edward
Bought by
Cook Billie J0
Purchase Details
Closed on
Jul 8, 2016
Sold by
Sullivan Tamathy Lynn
Bought by
Cook Billie Jo
Purchase Details
Closed on
Oct 21, 2008
Sold by
Rhineheimer Charles
Bought by
Lay Carol and Rhineheimer Joseph
Create a Home Valuation Report for This Property
The Home Valuation Report is an in-depth analysis detailing your home's value as well as a comparison with similar homes in the area
Home Values in the Area
Average Home Value in this Area
Purchase History
| Date | Buyer | Sale Price | Title Company |
|---|---|---|---|
| Cook Billie | -- | None Listed On Document | |
| Hinderer Eugene L | -- | None Available | |
| Cook Joshua | -- | None Available | |
| Cook Billie Jo | -- | None Available | |
| Cook Billie Jo | -- | None Available | |
| Cook Billie J0 | -- | None Available | |
| Cook Billie Jo | -- | None Available | |
| Lay Carol | -- | -- |
Source: Public Records
Tax History Compared to Growth
Tax History
| Year | Tax Paid | Tax Assessment Tax Assessment Total Assessment is a certain percentage of the fair market value that is determined by local assessors to be the total taxable value of land and additions on the property. | Land | Improvement |
|---|---|---|---|---|
| 2024 | $559 | $23,400 | $6,800 | $16,600 |
| 2023 | $1,067 | $21,700 | $6,200 | $15,500 |
| 2022 | $460 | $19,600 | $6,000 | $13,600 |
| 2021 | $405 | $17,100 | $5,700 | $11,400 |
| 2020 | $398 | $15,500 | $5,700 | $9,800 |
| 2019 | $376 | $14,900 | $5,700 | $9,200 |
| 2018 | $346 | $13,600 | $5,500 | $8,100 |
| 2017 | $322 | $13,100 | $5,500 | $7,600 |
| 2016 | $302 | $12,200 | $5,500 | $6,700 |
| 2014 | $402 | $18,100 | $5,900 | $12,200 |
| 2013 | $406 | $18,400 | $6,000 | $12,400 |
Source: Public Records
Map
Nearby Homes