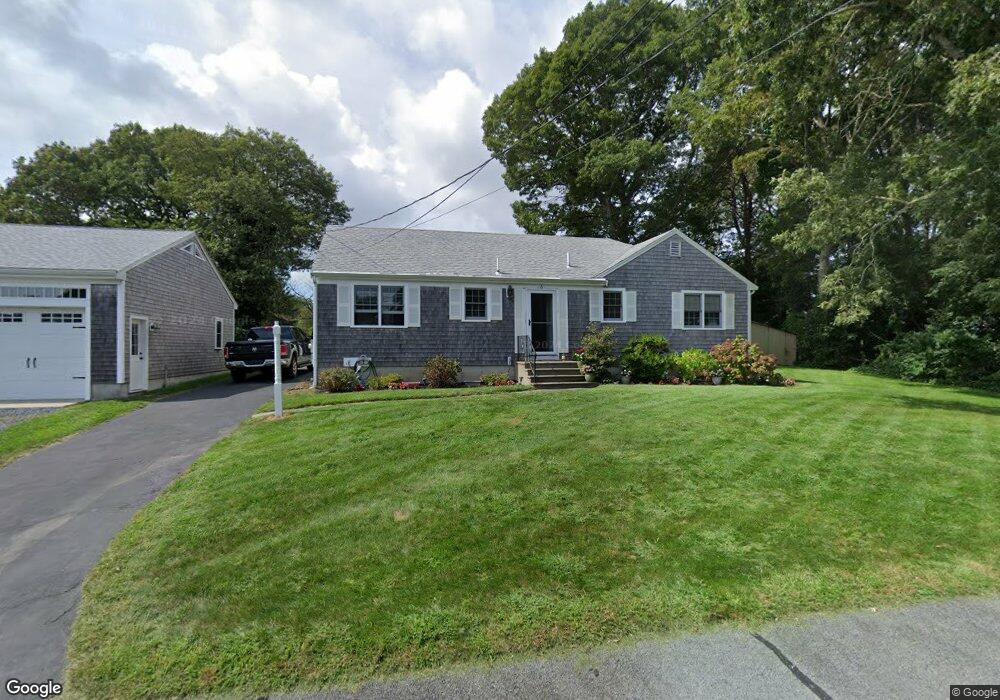
5 Sallys Way South Dennis, MA 02660
South Dennis NeighborhoodEstimated Value: $621,000 - $673,400
3
Beds
2
Baths
1,356
Sq Ft
$479/Sq Ft
Est. Value
About This Home
This home is located at 5 Sallys Way, South Dennis, MA 02660 and is currently estimated at $649,100, approximately $478 per square foot. 5 Sallys Way is a home located in Barnstable County with nearby schools including Dennis-Yarmouth Regional High School and St. Pius X. School.
Ownership History
Date
Name
Owned For
Owner Type
Purchase Details
Closed on
Feb 26, 2009
Sold by
Alden Deborah R and Alden Mark J
Bought by
Olds Rt 2
Current Estimated Value
Home Financials for this Owner
Home Financials are based on the most recent Mortgage that was taken out on this home.
Original Mortgage
$25,000
Outstanding Balance
$15,787
Interest Rate
5%
Mortgage Type
Purchase Money Mortgage
Estimated Equity
$633,313
Create a Home Valuation Report for This Property
The Home Valuation Report is an in-depth analysis detailing your home's value as well as a comparison with similar homes in the area
Home Values in the Area
Average Home Value in this Area
Purchase History
| Date | Buyer | Sale Price | Title Company |
|---|---|---|---|
| Olds Rt 2 | -- | -- | |
| Alden Deborah R | -- | -- |
Source: Public Records
Mortgage History
| Date | Status | Borrower | Loan Amount |
|---|---|---|---|
| Open | Alden Deborah R | $25,000 | |
| Closed | Olds Rt 2 | $25,000 |
Source: Public Records
Tax History Compared to Growth
Tax History
| Year | Tax Paid | Tax Assessment Tax Assessment Total Assessment is a certain percentage of the fair market value that is determined by local assessors to be the total taxable value of land and additions on the property. | Land | Improvement |
|---|---|---|---|---|
| 2025 | $2,653 | $612,800 | $156,800 | $456,000 |
| 2024 | $2,549 | $580,600 | $150,800 | $429,800 |
| 2023 | $2,469 | $528,700 | $137,100 | $391,600 |
| 2022 | $2,420 | $432,100 | $137,200 | $294,900 |
| 2021 | $2,336 | $387,400 | $134,500 | $252,900 |
| 2020 | $2,227 | $365,100 | $134,500 | $230,600 |
| 2019 | $2,188 | $354,700 | $145,100 | $209,600 |
| 2018 | $1,905 | $300,500 | $125,500 | $175,000 |
| 2017 | $1,814 | $294,900 | $125,500 | $169,400 |
| 2016 | $1,784 | $273,200 | $131,800 | $141,400 |
| 2015 | $1,748 | $273,200 | $131,800 | $141,400 |
| 2014 | $1,615 | $254,400 | $113,000 | $141,400 |
Source: Public Records
Map
Nearby Homes
- 17 Margate Ln
- 11 Uncle Stanleys Way
- 153 Bayridge Dr
- 15 Captain Jud Rd
- 4 Ebb Rd
- 10 Joanne Dr
- 17 Fairmount Rd
- 17 Fairmount Rd
- 25 Skerry Rd
- 7 Vinland Dr
- 118 Driftwood Ln
- 13 Covey Dr
- 1 Norseman Dr
- 129 Driftwood Ln
- 111 Merchant Ave
- 62 Old Fish House Rd
- 6 Hawthorn St
- 32 Captain Walsh Dr
- 6 Nimble Hill Dr
- 4 Old Colony Way