5 Scandinavian Dr Windham, NY 12496
Estimated Value: $272,000 - $467,000
About This Home
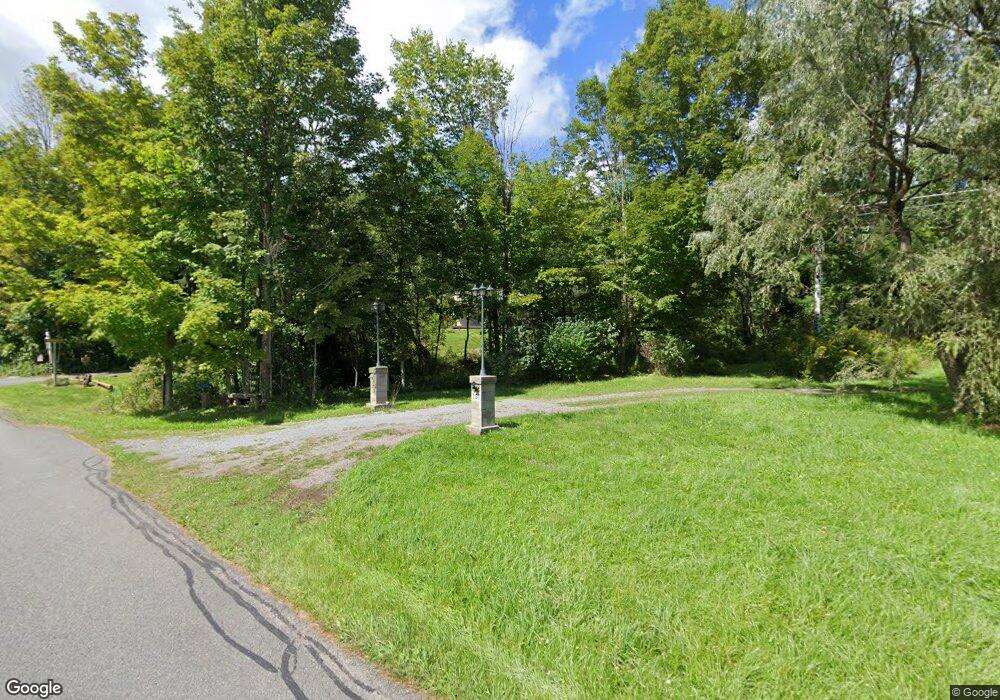
This home is located at 5 Scandinavian Dr, Windham, NY 12496 and is currently estimated at $383,874, approximately $169 per square foot. 5 Scandinavian Dr is a home located in Greene County with nearby schools including Windham-Ashland-Jewett Central School.
Ownership History
We collect this data history from publicly available records. To have your information removed, we recommend requesting removal directly through your county’s website.
Purchase Details
Purchase Details
Purchase Details
Purchase Details
Purchase Details
Purchase Details
Purchase Details
Purchase Details
Home Values in the Area
Average Home Value in this Area
Purchase History
We collect this data history from publicly available records. To have your information removed, we recommend requesting removal directly through your county’s website.
| Date | Buyer | Sale Price | Title Company |
|---|---|---|---|
| -- | None Available | ||
| -- | None Available | ||
| -- | -- | ||
| $300,000 | -- | ||
| $800,000 | -- | ||
| $110,000 | -- | ||
| $300,000 | -- | ||
| $155,000 | Kevin Kelleher | ||
| $35,000 | -- |
Mortgage History
We collect this data history from publicly available records. To have your information removed, we recommend requesting removal directly through your county’s website.
| Date | Status | Borrower | Loan Amount |
|---|---|---|---|
| Closed | $0 |
Tax History
We collect this data history from publicly available records. To have your information removed, we recommend requesting removal directly through your county’s website.
| Year | Tax Paid | Tax Assessment Tax Assessment Total Assessment is a certain percentage of the fair market value that is determined by local assessors to be the total taxable value of land and additions on the property. | Land | Improvement |
|---|---|---|---|---|
| 2025 | $3,134 | $180,000 | $22,000 | $158,000 |
| 2024 | $2,997 | $180,000 | $22,000 | $158,000 |
| 2023 | $2,919 | $180,000 | $22,000 | $158,000 |
| 2022 | $2,886 | $180,000 | $22,000 | $158,000 |
| 2021 | $2,894 | $180,000 | $22,000 | $158,000 |
| 2020 | $2,909 | $180,000 | $22,000 | $158,000 |
| 2019 | $2,905 | $180,000 | $22,000 | $158,000 |
| 2018 | $2,905 | $180,000 | $22,000 | $158,000 |
| 2017 | $3,027 | $182,300 | $22,000 | $160,300 |
| 2016 | $2,940 | $182,300 | $22,000 | $160,300 |
| 2015 | -- | $182,300 | $22,000 | $160,300 |
| 2014 | -- | $182,300 | $22,000 | $160,300 |
Map
- 110 Old Rd
- 27 Anchor Camp Rd
- 34 Old Rd
- 31 Windham Farms Rd
- 4 Windham Farms Rd
- 2 Windham Farms Rd
- 5134 New York 23
- 3 South St
- 7 Quads Way
- 41 Quads Way
- 55 Quads Way
- 216 New York 296
- 2 Lot Galway Rd
- 10 Galway Rd
- 1 Galway Rd
- 9 Galway Rd
- 3 Galway Rd
- 274 N Brooksburg Rd Unit 35
- 274 Brooksburgh Rd Unit 48
- 274 Brooksburgh Rd Unit 67
- 143 Old Rd
- 15 Scandinavian Dr
- 0 Scandinavian Dr
- 139 Old Rd
- 22 Cambridge Heights Rd
- 150 Old Rd
- 135 Old Rd
- 151 Old Rd
- 159 Old Rd
- 15 Cambridge Heights Rd
- 31 Scandinavian Dr
- 8 Andys Rd
- 28 Cambridge Heights Rd
- 104 Cambridge Heights Rd
- 11 St Clair Rd
- 11 Saint Clair Rd
- 37 Cambridge Heights Rd
- 94 Cambridge Heights Rd
- 22 Andys Rd
- 20 St Clair Rd
Ask me questions while you tour the home.