Estimated Value: $409,000 - $513,000
3
Beds
1
Bath
816
Sq Ft
$570/Sq Ft
Est. Value
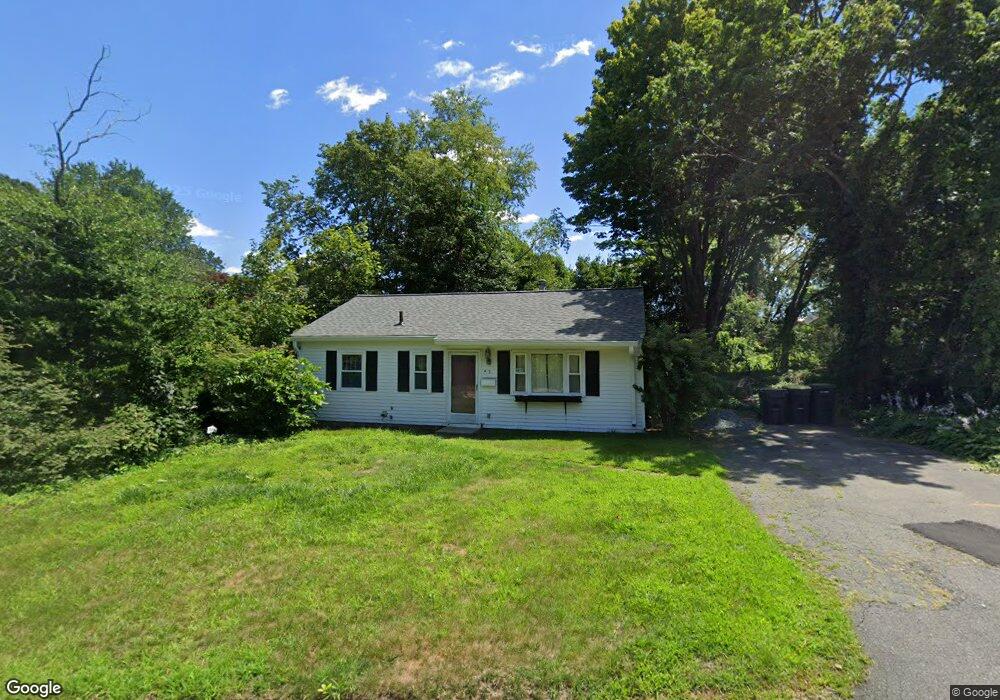
About This Home
This home is located at 5 School St, Avon, MA 02322 and is currently estimated at $465,212, approximately $570 per square foot. 5 School St is a home located in Norfolk County with nearby schools including Ralph D. Butler Elementary School and Avon Middle/High School.
Ownership History
Date
Name
Owned For
Owner Type
Purchase Details
Closed on
Jul 22, 2024
Sold by
Stevens Thomas E
Bought by
Stevens Suzanne M
Current Estimated Value
Home Financials for this Owner
Home Financials are based on the most recent Mortgage that was taken out on this home.
Original Mortgage
$309,065
Outstanding Balance
$304,713
Interest Rate
6.12%
Mortgage Type
FHA
Estimated Equity
$160,499
Purchase Details
Closed on
Jun 28, 2007
Sold by
Hubbard Beverly J and Hubbard Richard A
Bought by
Stevens Suzanne M and Stevens Thomas E
Home Financials for this Owner
Home Financials are based on the most recent Mortgage that was taken out on this home.
Original Mortgage
$185,948
Interest Rate
6.24%
Mortgage Type
Purchase Money Mortgage
Create a Home Valuation Report for This Property
The Home Valuation Report is an in-depth analysis detailing your home's value as well as a comparison with similar homes in the area
Home Values in the Area
Average Home Value in this Area
Purchase History
| Date | Buyer | Sale Price | Title Company |
|---|---|---|---|
| Stevens Suzanne M | -- | None Available | |
| Stevens Suzanne M | -- | None Available | |
| Stevens Suzanne M | $229,000 | -- | |
| Stevens Suzanne M | $229,000 | -- |
Source: Public Records
Mortgage History
| Date | Status | Borrower | Loan Amount |
|---|---|---|---|
| Open | Stevens Suzanne M | $309,065 | |
| Closed | Stevens Suzanne M | $309,065 | |
| Previous Owner | Stevens Suzanne M | $185,948 |
Source: Public Records
Tax History
| Year | Tax Paid | Tax Assessment Tax Assessment Total Assessment is a certain percentage of the fair market value that is determined by local assessors to be the total taxable value of land and additions on the property. | Land | Improvement |
|---|---|---|---|---|
| 2025 | $46 | $345,100 | $179,900 | $165,200 |
| 2024 | $4,302 | $306,600 | $170,600 | $136,000 |
| 2023 | $4,176 | $306,600 | $170,600 | $136,000 |
| 2022 | $4,212 | $266,400 | $142,200 | $124,200 |
| 2021 | $3,875 | $230,900 | $128,900 | $102,000 |
| 2020 | $4,144 | $234,100 | $126,500 | $107,600 |
| 2019 | $3,855 | $214,300 | $126,500 | $87,800 |
| 2018 | $3,933 | $212,000 | $126,500 | $85,500 |
| 2017 | $3,492 | $202,100 | $126,500 | $75,600 |
| 2016 | $3,634 | $212,400 | $126,500 | $85,900 |
| 2015 | $3,227 | $197,100 | $115,000 | $82,100 |
Source: Public Records
Map
Nearby Homes
Your Personal Tour Guide
Ask me questions while you tour the home.