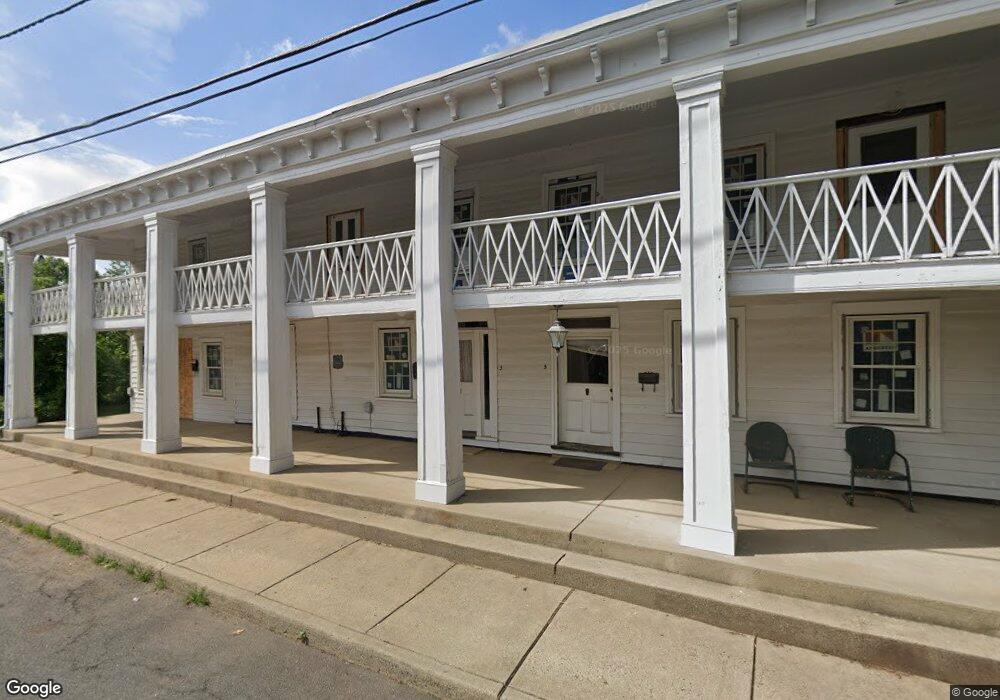
5 Scott Ave Cranbury, NJ 08512
Estimated Value: $660,367 - $794,000
3
Beds
1
Bath
3,875
Sq Ft
$183/Sq Ft
Est. Value
About This Home
This home is located at 5 Scott Ave, Cranbury, NJ 08512 and is currently estimated at $708,092, approximately $182 per square foot. 5 Scott Ave is a home located in Middlesex County with nearby schools including The Cranbury School, SciCore Academy, and E Windsor Knowledge Beginnings.
Ownership History
Date
Name
Owned For
Owner Type
Purchase Details
Closed on
Oct 20, 2023
Sold by
Bird Carolyn A and Bird Edward F
Bought by
Fanik Fayez Y
Current Estimated Value
Purchase Details
Closed on
Apr 12, 2002
Sold by
Stults C Gordon
Bought by
Bird Carolyn
Home Financials for this Owner
Home Financials are based on the most recent Mortgage that was taken out on this home.
Original Mortgage
$250,000
Interest Rate
7.18%
Create a Home Valuation Report for This Property
The Home Valuation Report is an in-depth analysis detailing your home's value as well as a comparison with similar homes in the area
Home Values in the Area
Average Home Value in this Area
Purchase History
| Date | Buyer | Sale Price | Title Company |
|---|---|---|---|
| Fanik Fayez Y | $600,000 | Foundation Title | |
| Fanik Fayez Y | $600,000 | Foundation Title | |
| Bird Carolyn | $250,000 | -- |
Source: Public Records
Mortgage History
| Date | Status | Borrower | Loan Amount |
|---|---|---|---|
| Previous Owner | Bird Carolyn | $250,000 |
Source: Public Records
Tax History Compared to Growth
Tax History
| Year | Tax Paid | Tax Assessment Tax Assessment Total Assessment is a certain percentage of the fair market value that is determined by local assessors to be the total taxable value of land and additions on the property. | Land | Improvement |
|---|---|---|---|---|
| 2025 | $11,633 | $497,100 | $184,600 | $312,500 |
| 2024 | $11,468 | $634,300 | $184,600 | $449,700 |
| 2023 | $11,468 | $634,300 | $184,600 | $449,700 |
| 2022 | $11,303 | $634,300 | $184,600 | $449,700 |
| 2021 | $8,204 | $634,300 | $184,600 | $449,700 |
| 2020 | $11,291 | $634,300 | $184,600 | $449,700 |
| 2019 | $11,411 | $634,300 | $184,600 | $449,700 |
| 2018 | $12,489 | $634,300 | $184,600 | $449,700 |
| 2017 | $12,160 | $634,300 | $184,600 | $449,700 |
| 2016 | $12,261 | $634,300 | $184,600 | $449,700 |
| 2015 | $12,039 | $634,300 | $184,600 | $449,700 |
| 2014 | $12,083 | $634,300 | $184,600 | $449,700 |
Source: Public Records
Map
Nearby Homes