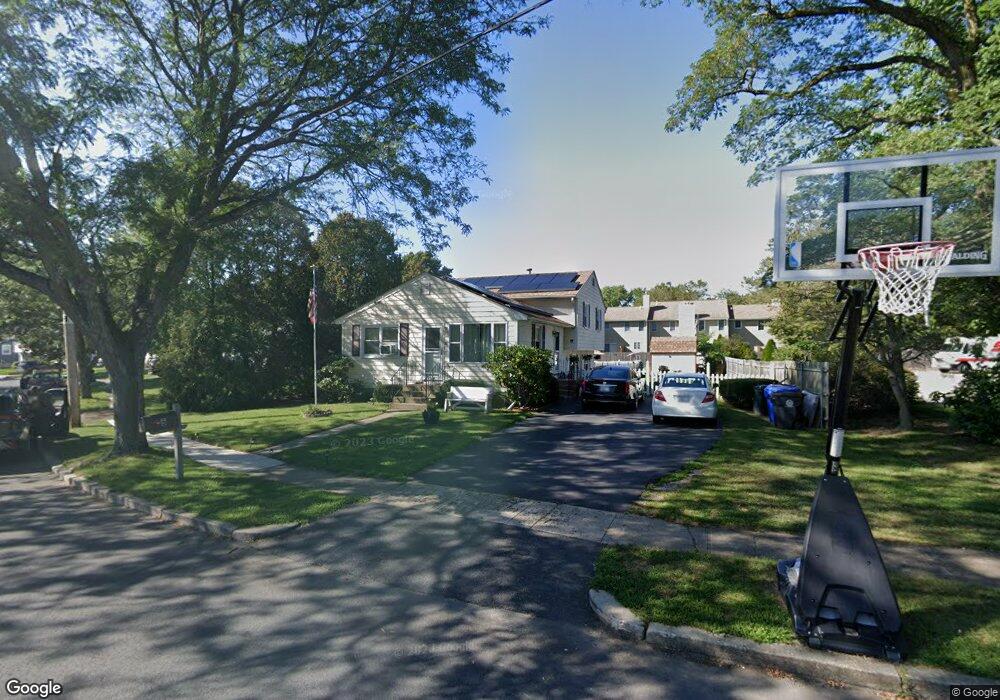
5 Scott Dr Riverside, RI 02915
Riverside NeighborhoodEstimated Value: $451,000 - $506,000
3
Beds
2
Baths
1,704
Sq Ft
$278/Sq Ft
Est. Value
About This Home
This home is located at 5 Scott Dr, Riverside, RI 02915 and is currently estimated at $473,092, approximately $277 per square foot. 5 Scott Dr is a home located in Providence County with nearby schools including East Providence High School, St Luke Elementary School, and St Mary Academy-Bay View.
Ownership History
Date
Name
Owned For
Owner Type
Purchase Details
Closed on
Aug 6, 1999
Sold by
Bourne Donald E and Bourne Janette
Bought by
Clark Paul M and Clark Holly L
Current Estimated Value
Home Financials for this Owner
Home Financials are based on the most recent Mortgage that was taken out on this home.
Original Mortgage
$97,100
Interest Rate
7.54%
Mortgage Type
Purchase Money Mortgage
Create a Home Valuation Report for This Property
The Home Valuation Report is an in-depth analysis detailing your home's value as well as a comparison with similar homes in the area
Home Values in the Area
Average Home Value in this Area
Purchase History
| Date | Buyer | Sale Price | Title Company |
|---|---|---|---|
| Clark Paul M | $110,000 | -- | |
| Clark Paul M | $110,000 | -- |
Source: Public Records
Mortgage History
| Date | Status | Borrower | Loan Amount |
|---|---|---|---|
| Open | Clark Paul M | $70,000 | |
| Open | Clark Paul M | $144,000 | |
| Closed | Clark Paul M | $26,000 | |
| Closed | Clark Paul M | $97,100 |
Source: Public Records
Tax History
| Year | Tax Paid | Tax Assessment Tax Assessment Total Assessment is a certain percentage of the fair market value that is determined by local assessors to be the total taxable value of land and additions on the property. | Land | Improvement |
|---|---|---|---|---|
| 2025 | $5,611 | $429,300 | $129,700 | $299,600 |
| 2024 | $5,421 | $353,600 | $108,200 | $245,400 |
| 2023 | $5,219 | $353,600 | $108,200 | $245,400 |
| 2022 | $4,894 | $223,900 | $59,100 | $164,800 |
| 2021 | $4,814 | $223,900 | $56,800 | $167,100 |
| 2020 | $4,610 | $223,900 | $56,800 | $167,100 |
| 2019 | $4,482 | $223,900 | $56,800 | $167,100 |
| 2018 | $4,841 | $211,600 | $55,400 | $156,200 |
| 2017 | $4,733 | $211,600 | $55,400 | $156,200 |
| 2016 | $4,710 | $211,600 | $55,400 | $156,200 |
| 2015 | $4,817 | $209,900 | $51,300 | $158,600 |
| 2014 | $4,817 | $209,900 | $51,300 | $158,600 |
Source: Public Records
Map
Nearby Homes
- 14 Winthrop St
- 14 Benedict St
- 25 Winslow St
- 15 Claire St
- 85 Hilton Ave
- 10 Booth Ave
- 15 Plaza Dr
- 103 Burnside Ave
- 23 Albert Ave
- 41 White Ave
- 72 Stowe Ave
- 25 Arnold St
- 33 Pine St Unit 35
- 0 Carousel Dr
- 151 Willett Ave Unit 2
- 28 Jefferson Ave
- 45 Washington Rd
- 129 Shore Rd
- 6 Hazelton Rd
- 916 Bullocks Pt Ave
Your Personal Tour Guide
Ask me questions while you tour the home.