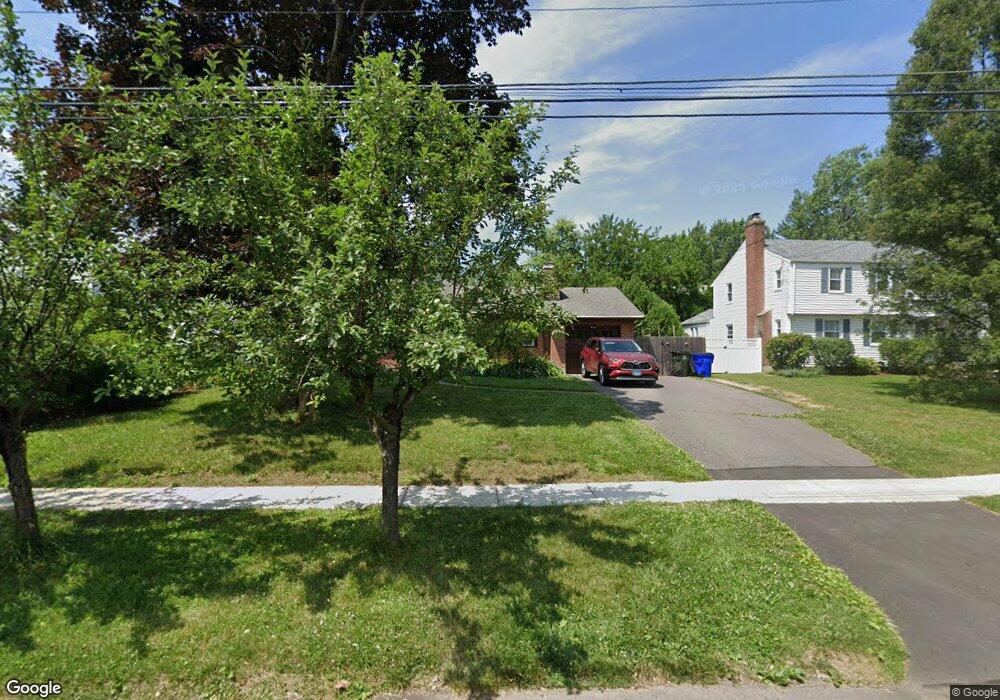
5 Seneca Rd West Hartford, CT 06117
Estimated Value: $364,043 - $417,000
2
Beds
1
Bath
1,104
Sq Ft
$356/Sq Ft
Est. Value
About This Home
This home is located at 5 Seneca Rd, West Hartford, CT 06117 and is currently estimated at $392,761, approximately $355 per square foot. 5 Seneca Rd is a home located in Hartford County with nearby schools including Aiken School, King Philip Middle School, and Delta High School.
Ownership History
Date
Name
Owned For
Owner Type
Purchase Details
Closed on
Aug 13, 2018
Sold by
Plaganis Margaret
Bought by
Margaret Plaganis Ret
Current Estimated Value
Home Financials for this Owner
Home Financials are based on the most recent Mortgage that was taken out on this home.
Original Mortgage
$75,000
Outstanding Balance
$61,564
Interest Rate
4.5%
Mortgage Type
Credit Line Revolving
Estimated Equity
$331,197
Purchase Details
Closed on
May 30, 2001
Sold by
Cassano Kim M
Bought by
Plaganis Margaret and Lacey Nicholas
Purchase Details
Closed on
Nov 1, 1995
Sold by
Sussler Robert and Sussler Karen
Bought by
Cassano Kim
Create a Home Valuation Report for This Property
The Home Valuation Report is an in-depth analysis detailing your home's value as well as a comparison with similar homes in the area
Home Values in the Area
Average Home Value in this Area
Purchase History
| Date | Buyer | Sale Price | Title Company |
|---|---|---|---|
| Margaret Plaganis Ret | -- | -- | |
| Plaganis Margaret | $156,000 | -- | |
| Cassano Kim | $112,000 | -- |
Source: Public Records
Mortgage History
| Date | Status | Borrower | Loan Amount |
|---|---|---|---|
| Open | Cassano Kim | $75,000 | |
| Previous Owner | Cassano Kim | $101,587 | |
| Previous Owner | Cassano Kim | $108,000 |
Source: Public Records
Tax History Compared to Growth
Tax History
| Year | Tax Paid | Tax Assessment Tax Assessment Total Assessment is a certain percentage of the fair market value that is determined by local assessors to be the total taxable value of land and additions on the property. | Land | Improvement |
|---|---|---|---|---|
| 2025 | $7,721 | $172,410 | $76,580 | $95,830 |
| 2024 | $7,302 | $172,410 | $76,580 | $95,830 |
| 2023 | $7,055 | $172,410 | $76,580 | $95,830 |
| 2022 | $7,014 | $172,410 | $76,580 | $95,830 |
| 2021 | $6,494 | $153,090 | $68,950 | $84,140 |
| 2020 | $5,832 | $139,510 | $61,530 | $77,980 |
| 2019 | $5,644 | $135,030 | $61,530 | $73,500 |
| 2018 | $5,536 | $135,030 | $61,530 | $73,500 |
| 2017 | $5,542 | $135,030 | $61,530 | $73,500 |
| 2016 | $5,266 | $133,280 | $55,650 | $77,630 |
| 2015 | $5,106 | $133,280 | $55,650 | $77,630 |
| 2014 | $4,981 | $133,280 | $55,650 | $77,630 |
Source: Public Records
Map
Nearby Homes
- 11 Lawler Rd
- 3 Pilgrim Rd
- 139 Mohawk Dr
- 320 N Steele Rd
- 1993 Albany Ave
- 3 Trumbull Ln
- 129 Middlebrook Rd
- 1272 Trout Brook Dr
- 5 Adams Ln
- 148 King Philip Dr
- 5 Northmoor Rd
- 62 Blue Ridge Ln
- 30 Farmstead Ln
- 111 Bloomfield Ave
- 2581 Albany Ave
- 47 Flagg Rd
- 9 Timberwood Rd
- 165 Bloomfield Ave
- 50 Magnolia Hill
- 1196 Trout Brook Dr