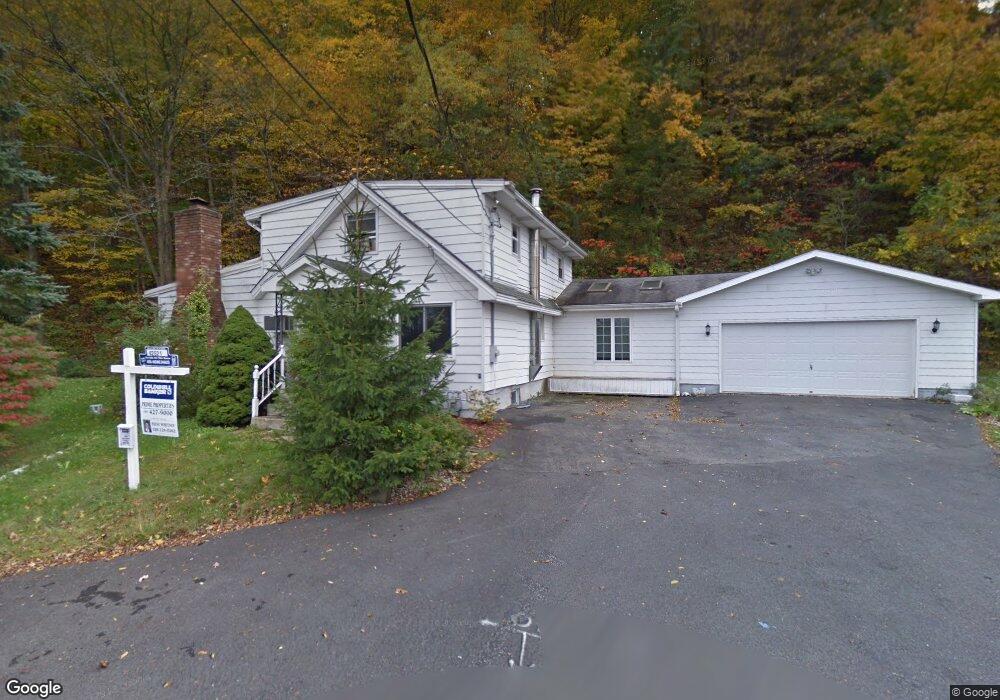
5 Severson Ave Extension Altamont, NY 12009
Estimated Value: $277,000 - $321,352
2
Beds
2
Baths
1,581
Sq Ft
$190/Sq Ft
Est. Value
About This Home
This home is located at 5 Severson Ave Extension, Altamont, NY 12009 and is currently estimated at $300,088, approximately $189 per square foot. 5 Severson Ave Extension is a home located in Albany County with nearby schools including Altamont Elementary School, Farnsworth Middle School, and Guilderland High School.
Ownership History
Date
Name
Owned For
Owner Type
Purchase Details
Closed on
Nov 18, 2011
Sold by
Gorman Shannon and Kruzinski John J
Bought by
Vincent Paul
Current Estimated Value
Home Financials for this Owner
Home Financials are based on the most recent Mortgage that was taken out on this home.
Original Mortgage
$137,823
Outstanding Balance
$94,344
Interest Rate
4.1%
Estimated Equity
$205,744
Purchase Details
Closed on
Mar 4, 2004
Sold by
Leyden Thomas P
Bought by
Gorman Shannon
Purchase Details
Closed on
Oct 10, 2000
Sold by
Housing Secretary Of & Urban Development
Bought by
Leyden Thomas P
Purchase Details
Closed on
Mar 16, 2000
Sold by
Doherty Carol H
Bought by
Secretary Of Housing & and Housing Secretary Of
Purchase Details
Closed on
Nov 10, 1998
Create a Home Valuation Report for This Property
The Home Valuation Report is an in-depth analysis detailing your home's value as well as a comparison with similar homes in the area
Home Values in the Area
Average Home Value in this Area
Purchase History
| Date | Buyer | Sale Price | Title Company |
|---|---|---|---|
| Vincent Paul | $133,000 | Sneeringer Monahan Provost R | |
| Gorman Shannon | $134,500 | Timothy Kelleher | |
| Leyden Thomas P | $42,000 | -- | |
| Secretary Of Housing & | $74,487 | -- | |
| -- | -- | -- |
Source: Public Records
Mortgage History
| Date | Status | Borrower | Loan Amount |
|---|---|---|---|
| Open | Vincent Paul | $137,823 |
Source: Public Records
Tax History Compared to Growth
Tax History
| Year | Tax Paid | Tax Assessment Tax Assessment Total Assessment is a certain percentage of the fair market value that is determined by local assessors to be the total taxable value of land and additions on the property. | Land | Improvement |
|---|---|---|---|---|
| 2024 | $5,842 | $220,000 | $44,000 | $176,000 |
| 2023 | $5,671 | $220,000 | $44,000 | $176,000 |
| 2022 | $4,602 | $220,000 | $44,000 | $176,000 |
| 2021 | $4,408 | $220,000 | $44,000 | $176,000 |
| 2020 | $4,766 | $220,000 | $44,000 | $176,000 |
| 2019 | $5,188 | $220,000 | $44,000 | $176,000 |
| 2018 | $3,073 | $134,500 | $43,500 | $91,000 |
| 2017 | $0 | $134,500 | $43,500 | $91,000 |
| 2016 | $3,248 | $134,500 | $43,500 | $91,000 |
| 2015 | -- | $134,500 | $43,500 | $91,000 |
| 2014 | -- | $134,500 | $43,500 | $91,000 |
Source: Public Records
Map
Nearby Homes
- 102 Severson Ave
- 101 Fairview Ave
- 116 Lark St
- 106 Euclid Ave
- 1127 Leesome Ln
- 107 Kelly Cir
- 802 Heather Ln
- 4 Groot Dr
- 6348 Gun Club Rd
- 145 C Bozenkill Rd
- 6025 Gardner Rd
- 1127 Meadowdale Rd
- 100 Bally Bay Ln
- 200 Maeotsa Ln
- 523 New York 146
- 25 Pleasant Valley Rd
- 500 State Route 146
- 1927 Berne Altamont Rd
- 420 Route 146
- 6990 State Route 158
- 5 Severson Ave Extension
- 977 Altamont Blvd
- 975 Altamont Blvd
- 979 Altamont Blvd
- 973 Altamont Blvd
- 121-25 Altamont Blvd
- 000 Altamont Blvd
- 981 Altamont Blvd
- 983 Altamont Blvd
- 971 Altamont Blvd
- 117 Severson Ave
- 972 Altamont Blvd
- 969 Altamont Blvd
- 985 Altamont Blvd
- 970 Altamont Blvd
- 978 Altamont Blvd
- 967 Altamont Blvd
- 115 Severson Ave
- 987 Altamont Blvd
- 974 Altamont Blvd