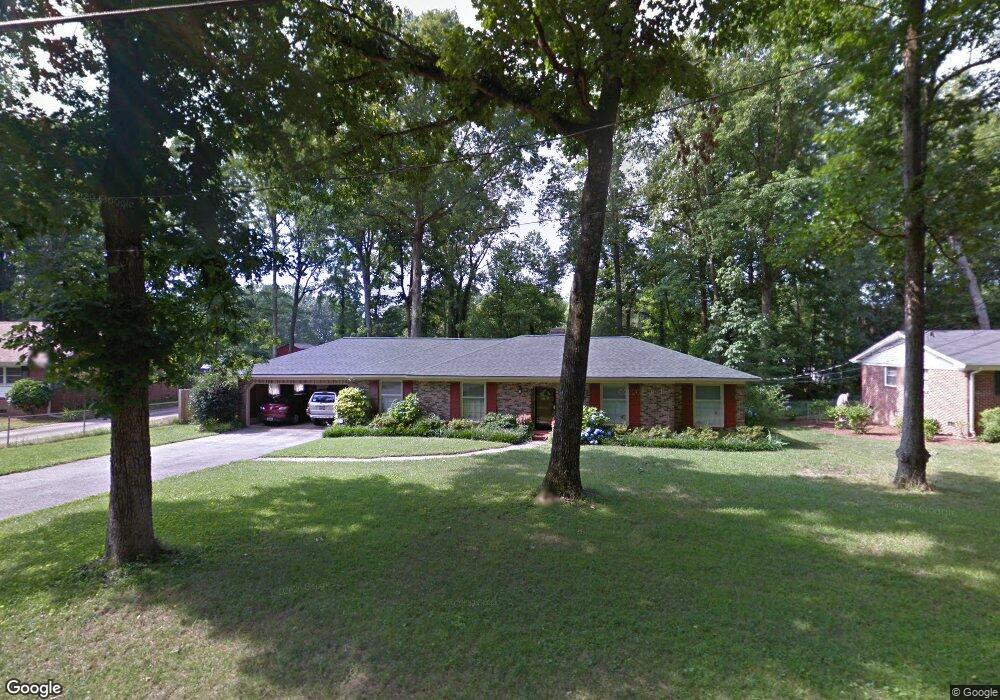
5 Sherbrook Ln Taylors, SC 29687
Estimated Value: $336,000 - $402,000
3
Beds
2
Baths
1,870
Sq Ft
$199/Sq Ft
Est. Value
About This Home
This home is located at 5 Sherbrook Ln, Taylors, SC 29687 and is currently estimated at $372,218, approximately $199 per square foot. 5 Sherbrook Ln is a home located in Greenville County with nearby schools including Lake Forest Elementary, Northwood Middle School, and Eastside High School.
Ownership History
Date
Name
Owned For
Owner Type
Purchase Details
Closed on
Aug 14, 2018
Sold by
Tuten Kenneth L and Tuten Cassy E
Bought by
Estepp Kyle A and Estepp Jamie D
Current Estimated Value
Home Financials for this Owner
Home Financials are based on the most recent Mortgage that was taken out on this home.
Original Mortgage
$228,000
Outstanding Balance
$198,009
Interest Rate
4.5%
Mortgage Type
New Conventional
Estimated Equity
$174,209
Purchase Details
Closed on
Mar 24, 2017
Sold by
Sammons Christine B
Bought by
Tuten Kenneth L and Tuten Cassy E
Home Financials for this Owner
Home Financials are based on the most recent Mortgage that was taken out on this home.
Original Mortgage
$130,000
Interest Rate
4.15%
Mortgage Type
New Conventional
Purchase Details
Closed on
May 11, 2015
Sold by
Sammons Melvin E and Sammons Chris B
Bought by
Sammons Melvin Eugene and Sammons Christine B
Create a Home Valuation Report for This Property
The Home Valuation Report is an in-depth analysis detailing your home's value as well as a comparison with similar homes in the area
Home Values in the Area
Average Home Value in this Area
Purchase History
| Date | Buyer | Sale Price | Title Company |
|---|---|---|---|
| Estepp Kyle A | $240,000 | None Available | |
| Tuten Kenneth L | $162,500 | None Available | |
| Sammons Melvin Eugene | -- | -- |
Source: Public Records
Mortgage History
| Date | Status | Borrower | Loan Amount |
|---|---|---|---|
| Open | Estepp Kyle A | $228,000 | |
| Previous Owner | Tuten Kenneth L | $130,000 |
Source: Public Records
Tax History Compared to Growth
Tax History
| Year | Tax Paid | Tax Assessment Tax Assessment Total Assessment is a certain percentage of the fair market value that is determined by local assessors to be the total taxable value of land and additions on the property. | Land | Improvement |
|---|---|---|---|---|
| 2024 | $2,288 | $9,140 | $960 | $8,180 |
| 2023 | $2,288 | $9,140 | $960 | $8,180 |
| 2022 | $2,146 | $9,140 | $960 | $8,180 |
| 2021 | $2,358 | $9,140 | $960 | $8,180 |
| 2020 | $2,444 | $9,020 | $1,250 | $7,770 |
| 2019 | $2,417 | $9,020 | $1,250 | $7,770 |
| 2018 | $1,751 | $6,410 | $960 | $5,450 |
| 2017 | $3,059 | $7,650 | $1,440 | $6,210 |
| 2016 | $906 | $127,550 | $24,000 | $103,550 |
| 2015 | $882 | $127,550 | $24,000 | $103,550 |
| 2014 | $1,408 | $144,770 | $24,000 | $120,770 |
Source: Public Records
Map
Nearby Homes