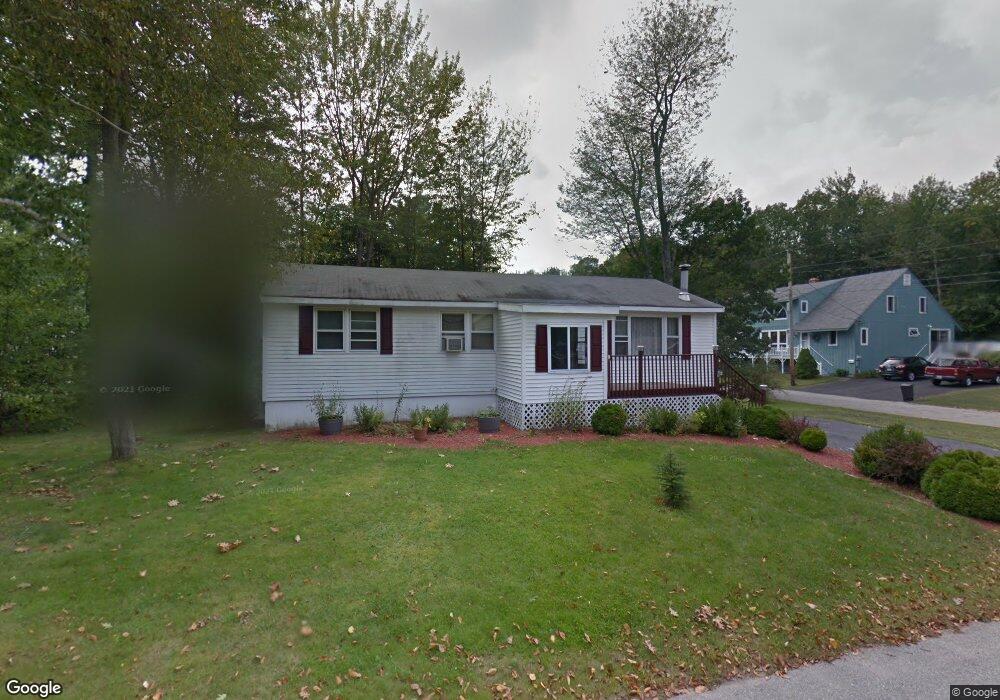
5 Shorewood Dr Old Orchard Beach, ME 04064
Estimated Value: $483,232 - $517,000
2
Beds
1
Bath
1,216
Sq Ft
$411/Sq Ft
Est. Value
About This Home
This home is located at 5 Shorewood Dr, Old Orchard Beach, ME 04064 and is currently estimated at $499,308, approximately $410 per square foot. 5 Shorewood Dr is a home located in York County with nearby schools including Jameson Elementary School, Loranger Memorial School, and Old Orchard Beach High School.
Ownership History
Date
Name
Owned For
Owner Type
Purchase Details
Closed on
Aug 21, 2020
Sold by
Additon Ryan
Bought by
Mcdonough Michele L
Current Estimated Value
Home Financials for this Owner
Home Financials are based on the most recent Mortgage that was taken out on this home.
Original Mortgage
$319,113
Outstanding Balance
$283,076
Interest Rate
3%
Mortgage Type
FHA
Estimated Equity
$216,232
Purchase Details
Closed on
Dec 20, 2019
Sold by
Maniscalco Rose and Locke James
Bought by
Us Bank Na Tr
Purchase Details
Closed on
Dec 19, 2019
Sold by
Locke James and Maniscalco Rose
Bought by
Us Bank Na Tr
Create a Home Valuation Report for This Property
The Home Valuation Report is an in-depth analysis detailing your home's value as well as a comparison with similar homes in the area
Home Values in the Area
Average Home Value in this Area
Purchase History
| Date | Buyer | Sale Price | Title Company |
|---|---|---|---|
| Mcdonough Michele L | -- | None Available | |
| Us Bank Na Tr | -- | None Available | |
| Us Bank Na Tr | -- | None Available |
Source: Public Records
Mortgage History
| Date | Status | Borrower | Loan Amount |
|---|---|---|---|
| Open | Mcdonough Michele L | $319,113 |
Source: Public Records
Tax History Compared to Growth
Tax History
| Year | Tax Paid | Tax Assessment Tax Assessment Total Assessment is a certain percentage of the fair market value that is determined by local assessors to be the total taxable value of land and additions on the property. | Land | Improvement |
|---|---|---|---|---|
| 2024 | $4,400 | $404,400 | $142,700 | $261,700 |
| 2023 | $4,106 | $360,200 | $132,400 | $227,800 |
| 2022 | $4,062 | $331,900 | $120,300 | $211,600 |
| 2021 | $3,897 | $275,200 | $108,900 | $166,300 |
| 2020 | $2,412 | $156,400 | $75,200 | $81,200 |
| 2019 | $3,036 | $195,900 | $75,200 | $120,700 |
| 2018 | $2,541 | $191,100 | $75,200 | $115,900 |
| 2017 | $2,815 | $179,300 | $69,300 | $110,000 |
| 2016 | $2,758 | $178,400 | $67,400 | $111,000 |
| 2015 | $2,708 | $178,400 | $67,400 | $111,000 |
| 2014 | $2,655 | $178,400 | $67,400 | $111,000 |
| 2013 | $2,462 | $178,400 | $67,400 | $111,000 |
Source: Public Records
Map
Nearby Homes
- 3 Arbutus Ave
- 43 Grove Ave
- 88 Saco Ave Unit 1
- 34 School St
- 113-115 Saco Ave
- 29 15th St
- 7 Heath St Unit 22
- 105 Union Ave
- 88 Union Ave Unit 301
- 3 Central Ave
- 161 Saco Ave Unit 113
- 2 Wintergreen St
- 4 Grandview Dr
- 5 Carll Ave
- 39 W Grand Ave Unit 410
- 39 W Grand Ave Unit 510
- 39 W Grand Ave Unit 23
- 5 4th Ave
- 21 Milliken St
- 9 Fern Ave