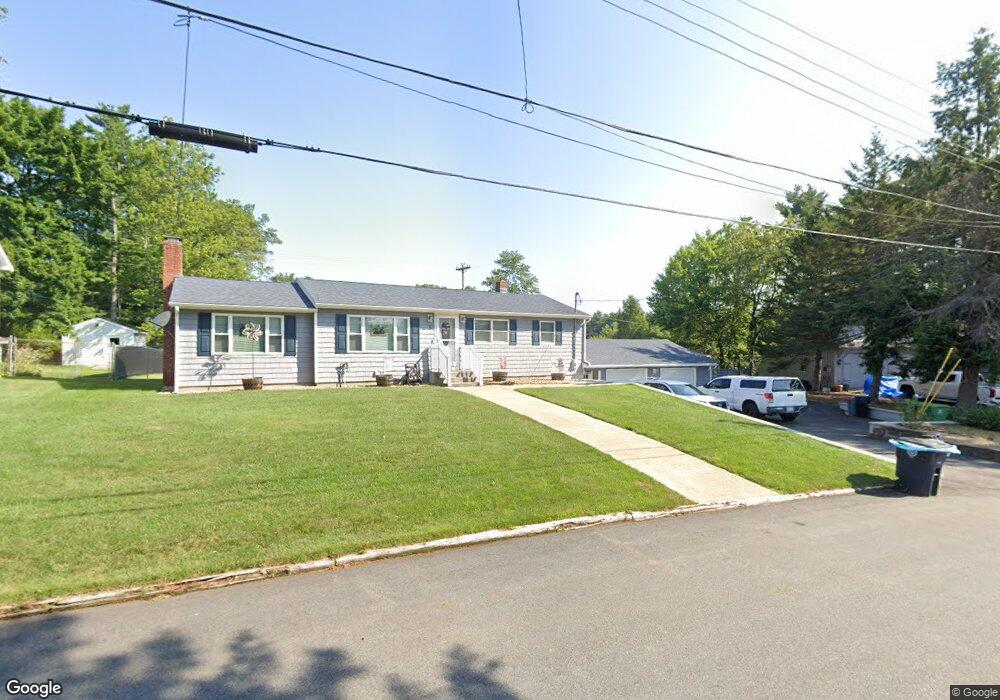
5 Sims St Nashua, NH 03063
Northwest Nashua NeighborhoodEstimated Value: $536,000 - $575,000
3
Beds
2
Baths
1,882
Sq Ft
$297/Sq Ft
Est. Value
About This Home
This home is located at 5 Sims St, Nashua, NH 03063 and is currently estimated at $558,823, approximately $296 per square foot. 5 Sims St is a home located in Hillsborough County with nearby schools including Birch Hill Elementary School, Elm Street Middle School, and Nashua High School North.
Ownership History
Date
Name
Owned For
Owner Type
Purchase Details
Closed on
Sep 22, 2010
Sold by
Cooner Donald E and Cooner Sandra L
Bought by
Turcotte Paula J and Turcotte Michael
Current Estimated Value
Home Financials for this Owner
Home Financials are based on the most recent Mortgage that was taken out on this home.
Original Mortgage
$40,000
Outstanding Balance
$25,946
Interest Rate
4.48%
Mortgage Type
Purchase Money Mortgage
Estimated Equity
$532,877
Create a Home Valuation Report for This Property
The Home Valuation Report is an in-depth analysis detailing your home's value as well as a comparison with similar homes in the area
Home Values in the Area
Average Home Value in this Area
Purchase History
We collect this data history from publicly available records. To have your information removed, we recommend requesting removal directly through your county’s website.
| Date | Buyer | Sale Price | Title Company |
|---|---|---|---|
| Turcotte Paula J | $258,000 | -- |
Source: Public Records
Mortgage History
We collect this data history from publicly available records. To have your information removed, we recommend requesting removal directly through your county’s website.
| Date | Status | Borrower | Loan Amount |
|---|---|---|---|
| Open | Turcotte Paula J | $40,000 | |
| Previous Owner | Turcotte Paula J | $35,000 |
Source: Public Records
Tax History
| Year | Tax Paid | Tax Assessment Tax Assessment Total Assessment is a certain percentage of the fair market value that is determined by local assessors to be the total taxable value of land and additions on the property. | Land | Improvement |
|---|---|---|---|---|
| 2025 | $8,122 | $482,600 | $174,200 | $308,400 |
| 2024 | $7,718 | $485,400 | $174,200 | $311,200 |
| 2023 | $7,385 | $405,100 | $139,400 | $265,700 |
| 2022 | $7,320 | $405,100 | $139,400 | $265,700 |
| 2021 | $6,646 | $286,200 | $92,900 | $193,300 |
| 2020 | $6,453 | $285,400 | $92,900 | $192,500 |
| 2019 | $6,210 | $285,400 | $92,900 | $192,500 |
| 2018 | $6,053 | $285,400 | $92,900 | $192,500 |
| 2017 | $5,390 | $209,000 | $80,700 | $128,300 |
| 2016 | $5,240 | $209,000 | $80,700 | $128,300 |
| 2015 | $5,078 | $207,000 | $80,700 | $126,300 |
| 2014 | $4,978 | $207,000 | $80,700 | $126,300 |
Source: Public Records
Map
Nearby Homes
- 14 Trinity Dr
- 14 Upstone Dr
- 2 Birch Hill Dr
- 401 Broad St
- 42 Dublin Ave
- 44 Coburn Woods
- 20 Shelburne Rd
- 45 Northwood Dr
- 5 Ivy Ln Unit U131
- 21 Gloucester Ln Unit U37
- 12 Fitzpatrick Cir Unit U81
- 3 Crimson Ct Unit U20
- 60 Pine Hill Rd
- 54 Pine Hill Rd
- 44 Broad St
- 293 Pine Hill Rd
- 264 Bartemus Trail Unit U17
- 39 Norma Dr Unit U18
- 40 Hollow Ridge Dr
- 8 Althea Ln Unit U26
Your Personal Tour Guide
Ask me questions while you tour the home.