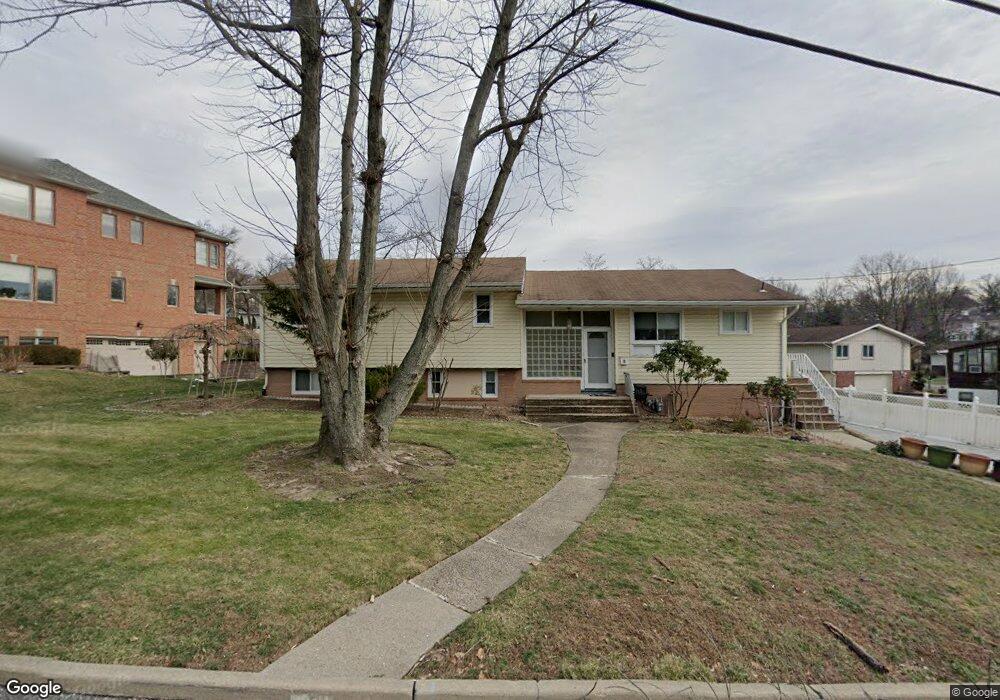
5 Skyline Dr Englewood Cliffs, NJ 07632
Estimated Value: $1,342,000 - $1,445,000
Studio
--
Bath
2,484
Sq Ft
$561/Sq Ft
Est. Value
About This Home
This home is located at 5 Skyline Dr, Englewood Cliffs, NJ 07632 and is currently estimated at $1,393,673, approximately $561 per square foot. 5 Skyline Dr is a home located in Bergen County with nearby schools including North Cliff Elementary School, Upper School Elementary School, and Englewood on the Palisades Charter School.
Ownership History
Date
Name
Owned For
Owner Type
Purchase Details
Closed on
Dec 24, 2009
Sold by
Lee Chong Ok and Kim Young Joo
Bought by
Kim Young Joo
Current Estimated Value
Purchase Details
Closed on
Aug 30, 2006
Sold by
Lee Woo Ick
Bought by
Kim Young Joo and Lee Chong O
Purchase Details
Closed on
Jul 6, 2001
Sold by
Reed Young C
Bought by
Lee Woo I and Kim Young J
Home Financials for this Owner
Home Financials are based on the most recent Mortgage that was taken out on this home.
Original Mortgage
$408,700
Interest Rate
7.14%
Purchase Details
Closed on
Nov 27, 1995
Sold by
Ziegler Louis and Ziegler Marilyn
Bought by
Reed Young Cha and Reed Alicia Choi
Home Financials for this Owner
Home Financials are based on the most recent Mortgage that was taken out on this home.
Original Mortgage
$259,000
Interest Rate
7.37%
Create a Home Valuation Report for This Property
The Home Valuation Report is an in-depth analysis detailing your home's value as well as a comparison with similar homes in the area
Home Values in the Area
Average Home Value in this Area
Purchase History
| Date | Buyer | Sale Price | Title Company |
|---|---|---|---|
| Kim Young Joo | $200,005 | None Available | |
| Kim Young Joo | $495,000 | -- | |
| Lee Woo I | $545,000 | -- | |
| Reed Young Cha | $345,000 | -- |
Source: Public Records
Mortgage History
| Date | Status | Borrower | Loan Amount |
|---|---|---|---|
| Previous Owner | Lee Woo I | $408,700 | |
| Previous Owner | Reed Young Cha | $259,000 |
Source: Public Records
Tax History
| Year | Tax Paid | Tax Assessment Tax Assessment Total Assessment is a certain percentage of the fair market value that is determined by local assessors to be the total taxable value of land and additions on the property. | Land | Improvement |
|---|---|---|---|---|
| 2025 | $11,322 | $980,300 | $792,600 | $187,700 |
| 2024 | $11,185 | $980,300 | $792,600 | $187,700 |
| 2023 | $11,009 | $980,300 | $792,600 | $187,700 |
| 2022 | $11,009 | $980,300 | $792,600 | $187,700 |
| 2021 | $8,462 | $980,300 | $792,600 | $187,700 |
| 2020 | $11,283 | $980,300 | $792,600 | $187,700 |
| 2019 | $10,597 | $980,300 | $792,600 | $187,700 |
| 2018 | $10,225 | $980,300 | $792,600 | $187,700 |
| 2017 | $9,783 | $980,300 | $792,600 | $187,700 |
| 2016 | $9,441 | $964,300 | $792,600 | $171,700 |
| 2015 | $8,968 | $964,300 | $792,600 | $171,700 |
| 2014 | $8,389 | $964,300 | $792,600 | $171,700 |
Source: Public Records
Map
Nearby Homes
- 320 Bolz St
- 316 Bolz St
- 312 Bolz St
- 307 Center St
- 45 Marjorie Terrace
- 394 E Palisade Ave
- 140 Demarest Ave
- 144 Demarest Ave
- 111 Demarest Ave
- 577 Floyd St
- 285 Maple St
- 292 Maple St
- 45 Beech Rd
- 306 Hutchinson Rd
- 2 Maple St
- 278 Fountain Rd
- 10 E Bayview Ave
- 48 Cambridge Place
- 231 N Woodland St
- 215 Brinckerhoff Ct
Your Personal Tour Guide
Ask me questions while you tour the home.