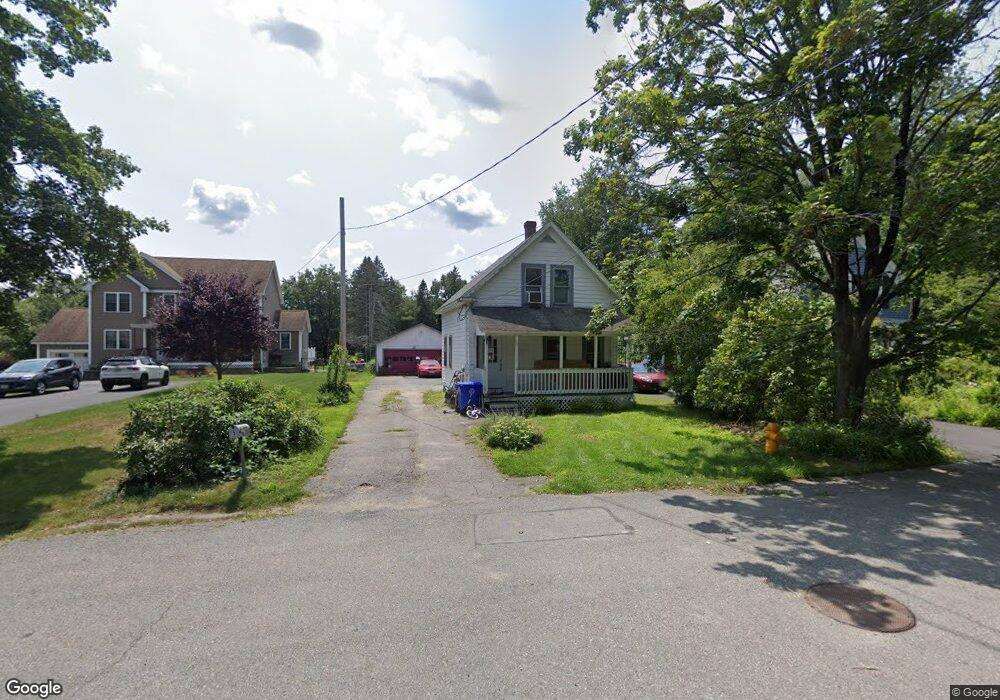
5 South St Shirley, MA 01464
Estimated Value: $411,000 - $460,000
3
Beds
2
Baths
1,160
Sq Ft
$373/Sq Ft
Est. Value
About This Home
This home is located at 5 South St, Shirley, MA 01464 and is currently estimated at $433,246, approximately $373 per square foot. 5 South St is a home located in Middlesex County with nearby schools including Page Hilltop School, Lura A. White Elementary School, and Ayer Shirley Regional Middle School.
Ownership History
Date
Name
Owned For
Owner Type
Purchase Details
Closed on
Aug 17, 2018
Sold by
Shorey Lowell A and Shorey Charlene
Bought by
Goodwin Max and Goodwin Natalie K
Current Estimated Value
Purchase Details
Closed on
Jun 26, 2007
Sold by
Shorey Lowell A
Bought by
Shorey Lowell A and Shorey Charlene
Home Financials for this Owner
Home Financials are based on the most recent Mortgage that was taken out on this home.
Original Mortgage
$50,500
Interest Rate
6.14%
Mortgage Type
Purchase Money Mortgage
Purchase Details
Closed on
May 20, 2005
Sold by
Pmm Rt and Maroni Pauline Mary
Bought by
Shorey Lowell A
Create a Home Valuation Report for This Property
The Home Valuation Report is an in-depth analysis detailing your home's value as well as a comparison with similar homes in the area
Home Values in the Area
Average Home Value in this Area
Purchase History
| Date | Buyer | Sale Price | Title Company |
|---|---|---|---|
| Goodwin Max | -- | -- | |
| Shorey Lowell A | -- | -- | |
| Shorey Lowell A | -- | -- |
Source: Public Records
Mortgage History
| Date | Status | Borrower | Loan Amount |
|---|---|---|---|
| Previous Owner | Shorey Lowell A | $50,500 |
Source: Public Records
Tax History Compared to Growth
Tax History
| Year | Tax Paid | Tax Assessment Tax Assessment Total Assessment is a certain percentage of the fair market value that is determined by local assessors to be the total taxable value of land and additions on the property. | Land | Improvement |
|---|---|---|---|---|
| 2025 | $44 | $339,200 | $135,100 | $204,100 |
| 2024 | $4,174 | $307,600 | $115,300 | $192,300 |
| 2023 | $4,060 | $286,300 | $115,300 | $171,000 |
| 2022 | $3,955 | $255,500 | $111,300 | $144,200 |
| 2021 | $3,868 | $234,000 | $99,400 | $134,600 |
| 2020 | $3,731 | $231,600 | $99,400 | $132,200 |
| 2019 | $3,568 | $221,900 | $99,400 | $122,500 |
| 2018 | $3,379 | $205,800 | $95,400 | $110,400 |
| 2017 | $3,109 | $188,200 | $87,400 | $100,800 |
| 2016 | $3,082 | $186,700 | $89,000 | $97,700 |
| 2015 | $2,989 | $172,700 | $83,500 | $89,200 |
Source: Public Records
Map
Nearby Homes
- 3 Mill St
- 25 Front St
- 30 Ayer Rd
- 40 Ayer Rd
- 0 Windsor Rd
- 3 Ambrose Way Unit 3
- 6 Ambrose Way Unit 3
- 9 Ambrose Way Unit 9
- 1 Ambrose Way Unit 1
- 7 Ambrose Way Unit 5
- 4 Ambrose Way Unit 4
- 5 Ambrose Way Unit 5
- 13 Ambrose Way Unit 13
- 45 Clark Rd
- 83 Clark Rd Unit 41
- 95 Old Union Turnpike
- 659 Reservoir Rd
- 45 Spring St
- 7 Lawson Ave
- 601 Flat Hill Rd