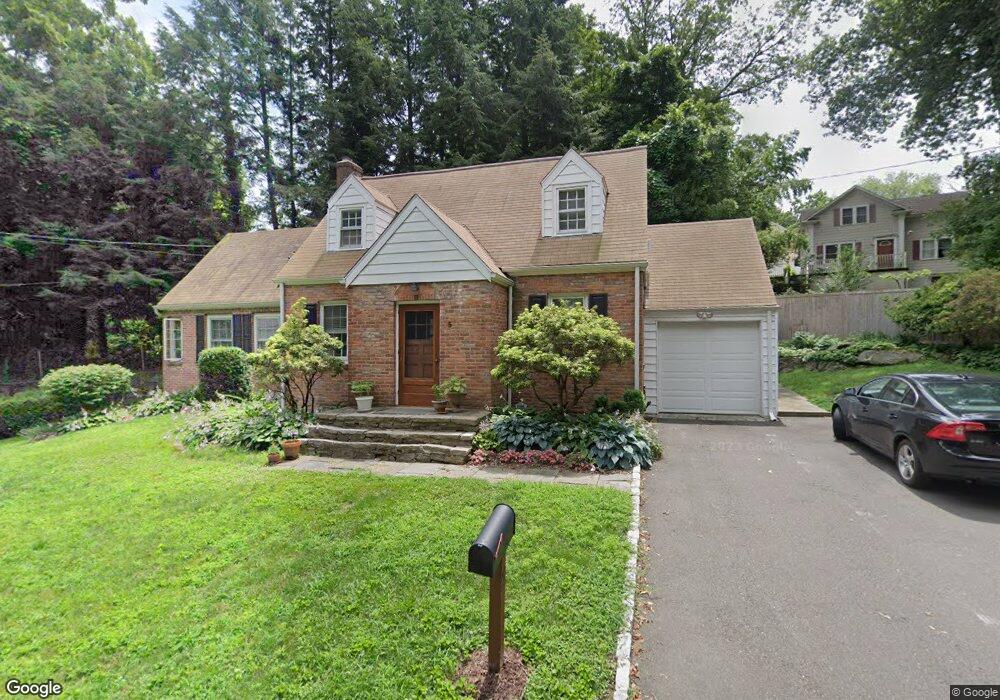
5 Spicewood Rd Norwalk, CT 06854
Brookside NeighborhoodEstimated Value: $641,591 - $676,000
3
Beds
2
Baths
1,612
Sq Ft
$410/Sq Ft
Est. Value
About This Home
This home is located at 5 Spicewood Rd, Norwalk, CT 06854 and is currently estimated at $660,898, approximately $409 per square foot. 5 Spicewood Rd is a home located in Fairfield County with nearby schools including Brookside Elementary School, Roton Middle School, and Brien Mcmahon High School.
Ownership History
Date
Name
Owned For
Owner Type
Purchase Details
Closed on
Apr 11, 2018
Sold by
Renzulli Carmine
Bought by
Franke Luc Llc
Current Estimated Value
Purchase Details
Closed on
Apr 14, 2008
Sold by
Marino Amanda J
Bought by
Lauri Francesco and Getek Kendall Ann
Home Financials for this Owner
Home Financials are based on the most recent Mortgage that was taken out on this home.
Original Mortgage
$368,000
Interest Rate
6.3%
Purchase Details
Closed on
Sep 5, 1997
Sold by
Kells David
Bought by
Marino Amanda and Kimball Christopher
Purchase Details
Closed on
May 6, 1991
Sold by
Rawlins Townsend and Rawlins Anne
Bought by
Kells David
Purchase Details
Closed on
Nov 23, 1987
Sold by
Shields Stephen
Bought by
Rawlins Townsend
Create a Home Valuation Report for This Property
The Home Valuation Report is an in-depth analysis detailing your home's value as well as a comparison with similar homes in the area
Home Values in the Area
Average Home Value in this Area
Purchase History
| Date | Buyer | Sale Price | Title Company |
|---|---|---|---|
| Franke Luc Llc | -- | -- | |
| Franke Luc Llc | -- | -- | |
| Lauri Francesco | $460,000 | -- | |
| Lauri Francesco | $460,000 | -- | |
| Marino Amanda | $208,500 | -- | |
| Marino Amanda | $208,500 | -- | |
| Kells David | $199,000 | -- | |
| Rawlins Townsend | $230,000 | -- |
Source: Public Records
Mortgage History
| Date | Status | Borrower | Loan Amount |
|---|---|---|---|
| Previous Owner | Rawlins Townsend | $368,000 | |
| Previous Owner | Rawlins Townsend | $69,000 |
Source: Public Records
Tax History
| Year | Tax Paid | Tax Assessment Tax Assessment Total Assessment is a certain percentage of the fair market value that is determined by local assessors to be the total taxable value of land and additions on the property. | Land | Improvement |
|---|---|---|---|---|
| 2025 | $8,715 | $363,960 | $160,730 | $203,230 |
| 2024 | $8,586 | $363,960 | $160,730 | $203,230 |
| 2023 | $6,381 | $253,620 | $122,780 | $130,840 |
| 2022 | $6,262 | $253,620 | $122,780 | $130,840 |
| 2021 | $6,100 | $253,620 | $122,780 | $130,840 |
| 2020 | $6,096 | $253,620 | $122,780 | $130,840 |
| 2019 | $5,926 | $253,620 | $122,780 | $130,840 |
| 2018 | $6,029 | $226,110 | $127,400 | $98,710 |
| 2017 | $5,821 | $226,110 | $127,400 | $98,710 |
| 2016 | $5,766 | $226,110 | $127,400 | $98,710 |
| 2015 | $5,777 | $227,190 | $127,400 | $99,790 |
| 2014 | $5,702 | $227,190 | $127,400 | $99,790 |
Source: Public Records
Map
Nearby Homes
- 24 Scribner Ave
- 5 Mcallister Ave
- 2 Rochelle Rd
- 12 Arbor Ct
- 8 Michael St
- 10 Keith St
- 4 Senga Rd
- 6 Norton Place
- 6 W Couch St
- 225 Flax Hill Rd Unit 2
- 18 Oakhill Ave
- 47 Taylor Ave
- 3 Edgewood St
- 8 Crown Ave
- 187 Flax Hill Rd Unit D5
- 18 Auburn St
- 115 Flax Hill Rd Unit 10
- 5 Topping Ln
- 15 Madison St Unit B7
- 9 Hollow Spring Rd
- 3 Spicewood Rd
- 8 Scribner Heights
- 4 Spicewood Rd
- 6 Spicewood Rd
- 10 Spicewood Rd
- 9 Spicewood Rd
- 15 Woodlawn Ave
- 11 Woodlawn Ave Unit 11A
- 12 Spicewood Rd
- 11 Scribner Ave
- 11 Scribner Ave
- 11 Scribner Ave Unit 1
- 11C Scribner Ave
- 7 Woodlawn Ave
- 7 Woodlawn Ave Unit 2
- 13 Spicewood Rd
- 14 Spicewood Rd
- 6 Oakledge Cir
- 14 Scribner Ave
- 19 Woodlawn Ave
Your Personal Tour Guide
Ask me questions while you tour the home.