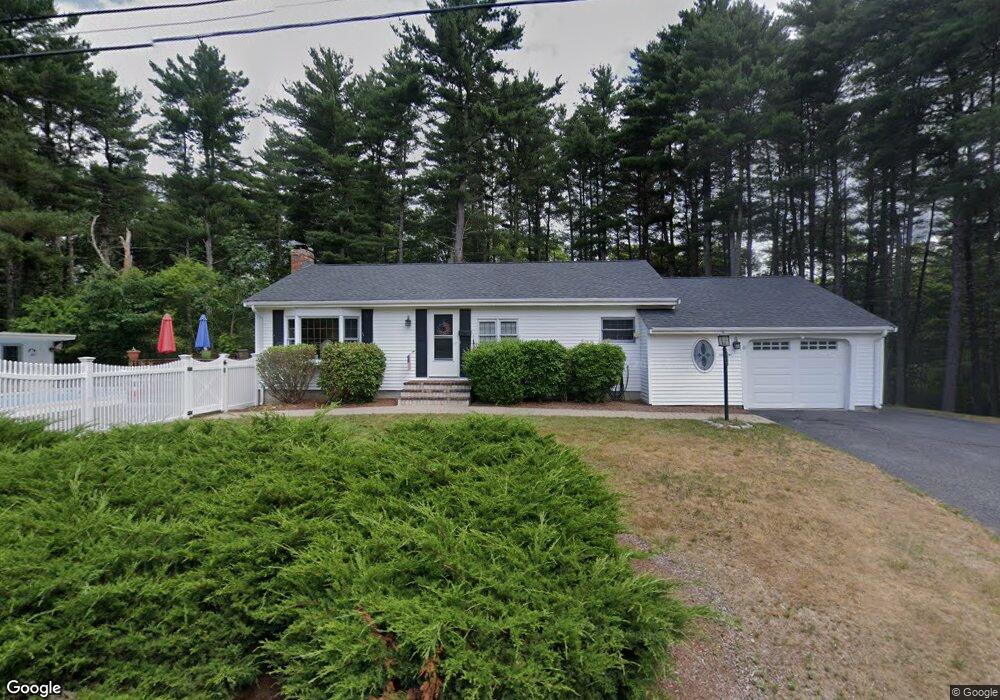
5 Sprague Rd Foxboro, MA 02035
Estimated Value: $595,000 - $784,000
2
Beds
1
Bath
1,092
Sq Ft
$601/Sq Ft
Est. Value
About This Home
This home is located at 5 Sprague Rd, Foxboro, MA 02035 and is currently estimated at $656,296, approximately $601 per square foot. 5 Sprague Rd is a home located in Norfolk County with nearby schools including Foxborough High School, Foxborough Regional Charter School, and Hands-On-Montessori School.
Ownership History
Date
Name
Owned For
Owner Type
Purchase Details
Closed on
Feb 19, 2010
Sold by
Gaudet Betty A and Glennon James J
Bought by
Griffin James T
Current Estimated Value
Home Financials for this Owner
Home Financials are based on the most recent Mortgage that was taken out on this home.
Original Mortgage
$250,000
Outstanding Balance
$166,613
Interest Rate
5.17%
Mortgage Type
Purchase Money Mortgage
Estimated Equity
$489,683
Create a Home Valuation Report for This Property
The Home Valuation Report is an in-depth analysis detailing your home's value as well as a comparison with similar homes in the area
Home Values in the Area
Average Home Value in this Area
Purchase History
| Date | Buyer | Sale Price | Title Company |
|---|---|---|---|
| Griffin James T | $282,000 | -- |
Source: Public Records
Mortgage History
| Date | Status | Borrower | Loan Amount |
|---|---|---|---|
| Open | Griffin James T | $250,000 |
Source: Public Records
Tax History Compared to Growth
Tax History
| Year | Tax Paid | Tax Assessment Tax Assessment Total Assessment is a certain percentage of the fair market value that is determined by local assessors to be the total taxable value of land and additions on the property. | Land | Improvement |
|---|---|---|---|---|
| 2025 | $7,214 | $545,700 | $294,100 | $251,600 |
| 2024 | $6,875 | $508,900 | $298,800 | $210,100 |
| 2023 | $6,529 | $459,500 | $285,000 | $174,500 |
| 2022 | $6,104 | $420,400 | $240,000 | $180,400 |
| 2021 | $5,737 | $389,200 | $222,600 | $166,600 |
| 2020 | $5,593 | $383,900 | $222,600 | $161,300 |
| 2019 | $5,404 | $367,600 | $212,200 | $155,400 |
| 2018 | $5,270 | $361,700 | $212,200 | $149,500 |
| 2017 | $5,058 | $336,300 | $198,600 | $137,700 |
| 2016 | $4,938 | $333,200 | $200,300 | $132,900 |
| 2015 | $4,647 | $305,900 | $170,200 | $135,700 |
| 2014 | $4,464 | $297,800 | $159,400 | $138,400 |
Source: Public Records
Map
Nearby Homes
- 80 Mill St
- 406 South St
- 356 Central St
- 12 Spring St
- 14 Baker St
- 24 Mechanic St
- 11 W Belcher Rd Unit 2
- 450 West St
- 84 Cocasset St Unit A6
- 483 Thurston St
- 277 Central St
- 16 Treasure Island Rd
- 18 Winter St Unit E
- 14 Winter St Unit B
- 166 Chauncy St
- 120 Hawes St
- 11 Goodwin Dr
- 9 Oak Dr
- 28 Angell St
- 44 Angell St Unit 44