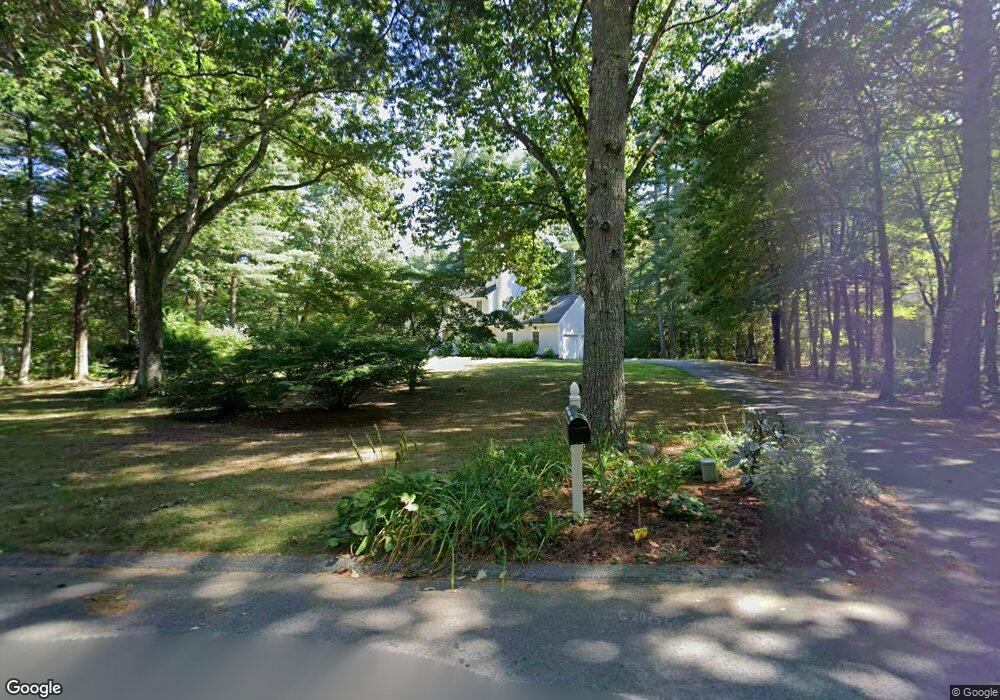
5 Squannacook Dr Groton, MA 01450
Estimated Value: $720,388 - $773,000
3
Beds
3
Baths
2,294
Sq Ft
$329/Sq Ft
Est. Value
About This Home
This home is located at 5 Squannacook Dr, Groton, MA 01450 and is currently estimated at $755,097, approximately $329 per square foot. 5 Squannacook Dr is a home located in Middlesex County with nearby schools including Groton Dunstable Regional High School.
Ownership History
Date
Name
Owned For
Owner Type
Purchase Details
Closed on
Jun 30, 2005
Sold by
Kaiser Diane and Kaiser Geoffrey
Bought by
Lesser Christopher J and Giaquinto-Lesser Jennine
Current Estimated Value
Home Financials for this Owner
Home Financials are based on the most recent Mortgage that was taken out on this home.
Original Mortgage
$400,000
Outstanding Balance
$209,748
Interest Rate
5.73%
Mortgage Type
Purchase Money Mortgage
Estimated Equity
$545,349
Purchase Details
Closed on
May 14, 1999
Sold by
Kenty Edward G and Kenty Barbara M
Bought by
Kaiser Geoffrey and Kaiser Diane
Home Financials for this Owner
Home Financials are based on the most recent Mortgage that was taken out on this home.
Original Mortgage
$225,000
Interest Rate
6.92%
Mortgage Type
Purchase Money Mortgage
Purchase Details
Closed on
Aug 31, 1995
Sold by
Matheny Michael J and Matheny Janine M
Bought by
Kenty Edward G and Kenty Barbara M
Purchase Details
Closed on
Dec 11, 1992
Sold by
Jl Rt
Bought by
Matheny Michael L and Matheny Janine M
Create a Home Valuation Report for This Property
The Home Valuation Report is an in-depth analysis detailing your home's value as well as a comparison with similar homes in the area
Home Values in the Area
Average Home Value in this Area
Purchase History
We collect this data history from publicly available records. To have your information removed, we recommend requesting removal directly through your county’s website.
| Date | Buyer | Sale Price | Title Company |
|---|---|---|---|
| Lesser Christopher J | $427,500 | -- | |
| Lesser Christopher J | $427,500 | -- | |
| Kaiser Geoffrey | $284,900 | -- | |
| Kenty Edward G | $208,000 | -- | |
| Matheny Michael L | $186,000 | -- |
Source: Public Records
Mortgage History
We collect this data history from publicly available records. To have your information removed, we recommend requesting removal directly through your county’s website.
| Date | Status | Borrower | Loan Amount |
|---|---|---|---|
| Open | Lesser Christopher J | $400,000 | |
| Closed | Matheny Michael L | $400,000 | |
| Previous Owner | Matheny Michael L | $225,000 | |
| Previous Owner | Matheny Michael L | $196,500 |
Source: Public Records
Tax History
| Year | Tax Paid | Tax Assessment Tax Assessment Total Assessment is a certain percentage of the fair market value that is determined by local assessors to be the total taxable value of land and additions on the property. | Land | Improvement |
|---|---|---|---|---|
| 2025 | $8,853 | $580,500 | $219,200 | $361,300 |
| 2024 | $8,660 | $573,900 | $219,200 | $354,700 |
| 2023 | $8,372 | $535,300 | $219,200 | $316,100 |
| 2022 | $7,742 | $450,400 | $192,700 | $257,700 |
| 2021 | $7,663 | $435,400 | $186,400 | $249,000 |
| 2020 | $7,322 | $421,300 | $186,400 | $234,900 |
| 2019 | $6,996 | $386,300 | $178,000 | $208,300 |
| 2018 | $6,583 | $352,600 | $169,500 | $183,100 |
| 2017 | $6,438 | $352,600 | $169,500 | $183,100 |
| 2016 | $6,473 | $344,700 | $163,000 | $181,700 |
| 2015 | $6,298 | $344,700 | $163,000 | $181,700 |
Source: Public Records
Map
Nearby Homes
- 20 Squannacook Dr
- Lot 10 Christian Cir
- 1 Kayla Ln
- 94 Turner Rd
- 8 South St
- 23 Bancroft St
- 57 Shattuck St
- 100 S Harbor Rd
- 111 Squannacook Rd
- 131 Jewett St
- 150 Kemp St
- 9 Celestial Way
- 26 Bradley Dr Unit D
- 143 Heald St
- Lot 3 Maple Ave
- 55 Beachview Rd
- 15 Hayes Woods Ln
- 5 Asher Ln
- 21 Emery Rd
- 1 Depot Street Extension Unit 1
- 47 Crosswinds Dr
- 62 Crosswinds Dr
- 41 Crosswinds Dr
- 29 Squannacook Dr
- 72 Crosswinds Dr
- 36 Crosswinds Dr
- 39 Squannacook Dr
- 26 Squannacook Dr
- 15 Spaulding Ln
- 3 Spaulding Ln
- 1 Spaulding Ln
- 5 Spaulding Ln
- 38 Crosswinds Dr
- 82 Crosswinds Dr
- 29 Crosswinds Dr
- 21 Spaulding Ln
- 43 Squannacook Dr
- 87 Crosswinds Dr
- 36 Squannacook Dr
- 86 Crosswinds Dr
Your Personal Tour Guide
Ask me questions while you tour the home.