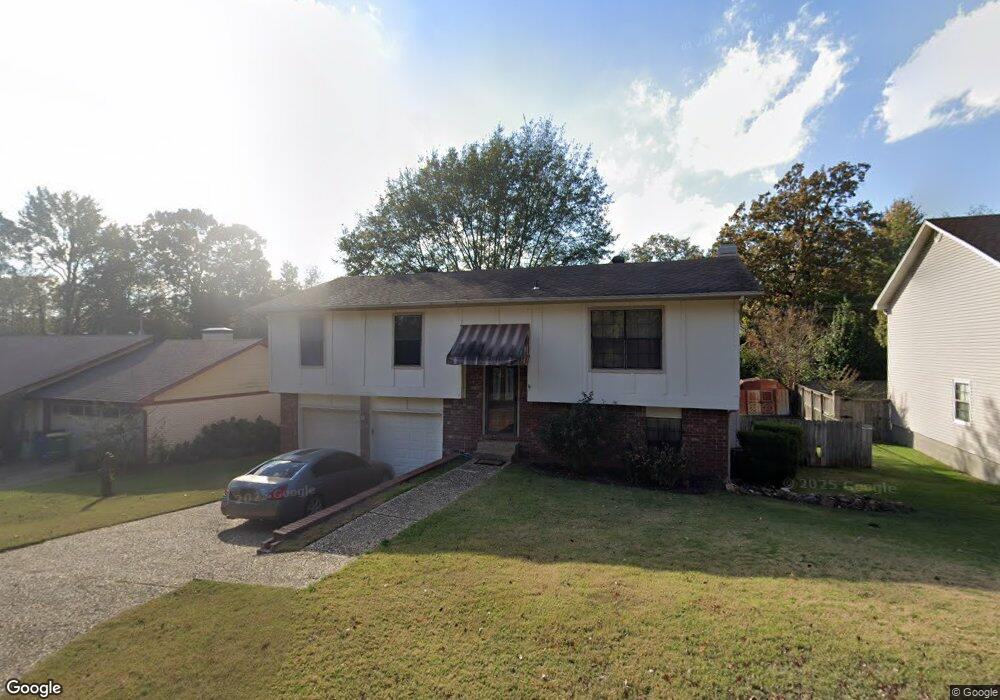
5 Stanwood Loop North Little Rock, AR 72118
Amboy NeighborhoodEstimated Value: $210,612 - $243,000
--
Bed
3
Baths
1,967
Sq Ft
$118/Sq Ft
Est. Value
About This Home
This home is located at 5 Stanwood Loop, North Little Rock, AR 72118 and is currently estimated at $231,153, approximately $117 per square foot. 5 Stanwood Loop is a home located in Pulaski County with nearby schools including Sylvan Hills Elementary School, Sylvan Hills Middle School, and Sylvan Hills High School.
Ownership History
Date
Name
Owned For
Owner Type
Purchase Details
Closed on
Sep 2, 2012
Sold by
Moffitt Reaves Carrie E
Bought by
Reaves Terry Lynn
Current Estimated Value
Purchase Details
Closed on
Dec 6, 2001
Sold by
Reaves Terry
Bought by
Reaves Terry L and Moffitt Reaves Carrie E
Home Financials for this Owner
Home Financials are based on the most recent Mortgage that was taken out on this home.
Original Mortgage
$107,874
Outstanding Balance
$41,541
Interest Rate
6.52%
Mortgage Type
FHA
Estimated Equity
$189,612
Purchase Details
Closed on
Nov 5, 1999
Sold by
Embry Sandy L and Embry Sherry L
Bought by
Beaves Terry
Home Financials for this Owner
Home Financials are based on the most recent Mortgage that was taken out on this home.
Original Mortgage
$105,034
Interest Rate
8.19%
Mortgage Type
FHA
Create a Home Valuation Report for This Property
The Home Valuation Report is an in-depth analysis detailing your home's value as well as a comparison with similar homes in the area
Home Values in the Area
Average Home Value in this Area
Purchase History
| Date | Buyer | Sale Price | Title Company |
|---|---|---|---|
| Reaves Terry Lynn | -- | None Available | |
| Reaves Terry L | -- | Lenders Title Co | |
| Beaves Terry | $106,000 | -- |
Source: Public Records
Mortgage History
| Date | Status | Borrower | Loan Amount |
|---|---|---|---|
| Open | Reaves Terry L | $107,874 | |
| Previous Owner | Beaves Terry | $105,034 |
Source: Public Records
Tax History Compared to Growth
Tax History
| Year | Tax Paid | Tax Assessment Tax Assessment Total Assessment is a certain percentage of the fair market value that is determined by local assessors to be the total taxable value of land and additions on the property. | Land | Improvement |
|---|---|---|---|---|
| 2025 | $2,251 | $38,020 | $7,800 | $30,220 |
| 2024 | $2,038 | $38,020 | $7,800 | $30,220 |
| 2023 | $2,038 | $38,020 | $7,800 | $30,220 |
| 2022 | $1,868 | $38,020 | $7,800 | $30,220 |
| 2021 | $1,698 | $28,690 | $5,200 | $23,490 |
| 2020 | $1,698 | $28,690 | $5,200 | $23,490 |
| 2019 | $1,698 | $28,690 | $5,200 | $23,490 |
| 2018 | $1,698 | $28,690 | $5,200 | $23,490 |
| 2017 | $1,698 | $28,690 | $5,200 | $23,490 |
| 2016 | $1,749 | $29,550 | $5,020 | $24,530 |
| 2015 | $1,749 | $29,550 | $5,020 | $24,530 |
| 2014 | $1,749 | $29,550 | $5,020 | $24,530 |
Source: Public Records
Map
Nearby Homes
- 13 Stanwood Loop
- 1100 Winnebago Dr
- 1218 Mission Rd
- 1100 Talihana Dr
- 1204 N Point Ln
- 10 Silverwood Ct
- 7405 Flintrock Rd
- 7200 Sequoyah Ln
- 7100 Sequoyah Ln
- 8 Minnehaha Ct
- 1209 Silverwood Trail
- 719 Spriggs Rd
- 126 Cobblestone Cir
- 1010 Claycut Cir
- 1115 Claycut Cir
- 1701 War Eagle Dr
- 1509 Wewoka Dr
- 1013 Kierre Dr
- 501 Silverwood Trail
- 1617 Saratoga Dr
- 7 Stanwood Loop
- 3 Stanwood Loop
- 1112 Mission Rd
- 9 Stanwood Loop
- 1 Stanwood Loop
- 6 Stanwood Loop
- 1104 Mission Rd
- 4 Stanwood Loop
- 8 Stanwood Loop
- 11 Stanwood Loop
- 2 Stanwood Loop
- 10 Stanwood Loop
- 1100 Mission Rd
- 12 Stanwood Loop
- 1101 Winnebago Dr
- 41 Stanwood Loop
- 39 Stanwood Loop
- 43 Stanwood Loop
- 1006 Mission Rd
- 37 Stanwood Loop