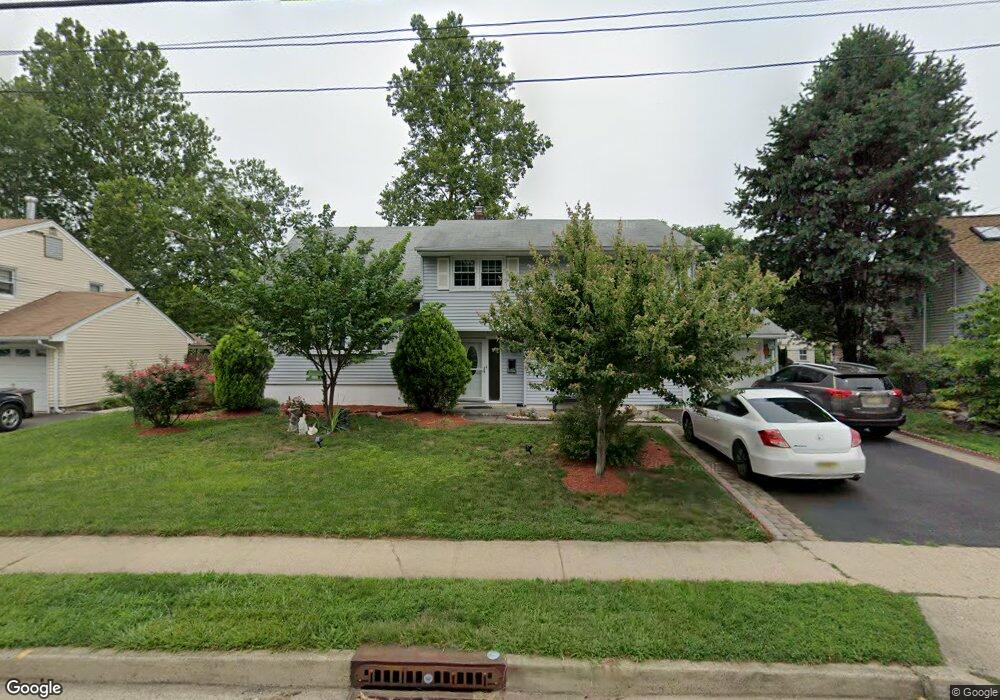
5 Starlit Dr Middlesex, NJ 08846
Estimated Value: $575,000 - $636,000
4
Beds
3
Baths
1,954
Sq Ft
$308/Sq Ft
Est. Value
About This Home
This home is located at 5 Starlit Dr, Middlesex, NJ 08846 and is currently estimated at $602,429, approximately $308 per square foot. 5 Starlit Dr is a home located in Middlesex County with nearby schools including Middlesex High School and Our Lady of Mount Virgin School.
Ownership History
Date
Name
Owned For
Owner Type
Purchase Details
Closed on
Feb 5, 2009
Sold by
Roney Kathleen L
Bought by
Diaz Maria Nely and Diaz Jose
Current Estimated Value
Home Financials for this Owner
Home Financials are based on the most recent Mortgage that was taken out on this home.
Original Mortgage
$50,000
Outstanding Balance
$31,538
Interest Rate
5.06%
Mortgage Type
Purchase Money Mortgage
Estimated Equity
$570,891
Create a Home Valuation Report for This Property
The Home Valuation Report is an in-depth analysis detailing your home's value as well as a comparison with similar homes in the area
Home Values in the Area
Average Home Value in this Area
Purchase History
| Date | Buyer | Sale Price | Title Company |
|---|---|---|---|
| Diaz Maria Nely | $270,000 | Fidelity Natl Title Ins Co |
Source: Public Records
Mortgage History
| Date | Status | Borrower | Loan Amount |
|---|---|---|---|
| Open | Diaz Maria Nely | $50,000 |
Source: Public Records
Tax History
| Year | Tax Paid | Tax Assessment Tax Assessment Total Assessment is a certain percentage of the fair market value that is determined by local assessors to be the total taxable value of land and additions on the property. | Land | Improvement |
|---|---|---|---|---|
| 2025 | $10,603 | $590,600 | $140,400 | $450,200 |
| 2024 | $10,094 | $458,200 | $140,400 | $317,800 |
Source: Public Records
Map
Nearby Homes
- 57 Greenbrook Rd
- 52 Greenbrook Rd
- 7 Weiss Dr
- 8 Juniper Pointe Trail
- 3038 King Ct
- 1108 Shadowlawn Dr Unit 701
- 1108 Shadowlawn Dr
- 1625 King Ct Unit 1625
- 1058 Shadowlawn Dr Unit 1258
- 1055 Shadowlawn Dr
- 112 Wallace Ct Unit 612
- 212 Vesper Ave
- 101 Lorraine Ave
- 14 New St
- 533 Edgeworth St
- 429 1st St
- 310 Howard Ave
- 241 Cook Ave
- 6 Harlow Pointe Cove
- 4 Harlow Pointe Cove
Your Personal Tour Guide
Ask me questions while you tour the home.