
Landlord's Agent in 2025
Mary Phelps
William Pitt
(203) 546-0315
48 in this area
109 Total Sales
Estimated Value: $389,000 - $477,000
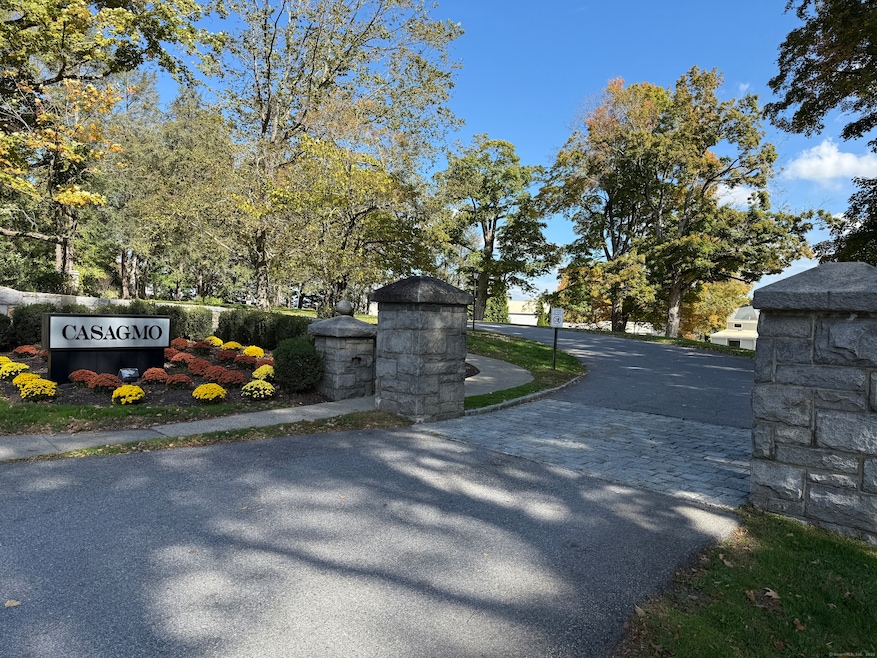
Turnkey condo set in the center of the historic and cultural district in beautiful Ridgefield, CT. This unit is light and bright, featuring hardwood floors in the main living areas. The entire unit is being painted, and the three bedrooms will have brand new carpet. The two full bathrooms are being updated. It has a lovely kitchen with ample cabinet space and newer appliances. There is a stackable washer & dryer in the unit - a rarity for Casagmo! Go through the large sliders to the private terrace and enjoy the afternoon sun. Close to shopping, the library, the movies, many restaurants, and shops. Enjoy the park across the way or take a swim in the association pool. Don't miss it!
Last Agent to Rent the Property
William Pitt Sotheby's Int'l Brokerage Phone: (203) 546-0315 License #RES.0789299 Listed on: 10/07/2025
| Date | Buyer | Sale Price | Title Company |
|---|---|---|---|
| Sanchez Segundo | $370,000 | None Available | |
| Devaul Donna | $318,000 | -- | |
| Moylan Francis P | $135,000 | -- | |
| Morrison Claire | $129,000 | -- | |
| Morrison Claire | $129,000 | -- |
| Date | Status | Borrower | Loan Amount |
|---|---|---|---|
| Open | Sanchez Segundo | $277,500 | |
| Previous Owner | Morrison Claire | $50,000 |
| Date | Event | Price | List to Sale | Price per Sq Ft |
|---|---|---|---|---|
| 12/01/2025 12/01/25 | Rented | $3,600 | 0.0% | -- |
| 10/27/2025 10/27/25 | Under Contract | -- | -- | -- |
| 10/07/2025 10/07/25 | For Rent | $3,600 | -- | -- |
| Year | Tax Paid | Tax Assessment Tax Assessment Total Assessment is a certain percentage of the fair market value that is determined by local assessors to be the total taxable value of land and additions on the property. | Land | Improvement |
|---|---|---|---|---|
| 2025 | $4,847 | $176,960 | $0 | $176,960 |
| 2024 | $4,663 | $176,960 | $0 | $176,960 |
| 2023 | $4,567 | $176,960 | $0 | $176,960 |
| 2022 | $4,024 | $141,540 | $0 | $141,540 |
| 2021 | $3,993 | $141,540 | $0 | $141,540 |
| 2020 | $3,980 | $141,540 | $0 | $141,540 |
| 2019 | $3,980 | $141,540 | $0 | $141,540 |
| 2018 | $3,932 | $141,540 | $0 | $141,540 |
| 2017 | $4,118 | $151,330 | $0 | $151,330 |
| 2016 | $4,039 | $151,330 | $0 | $151,330 |
| 2015 | $3,936 | $151,330 | $0 | $151,330 |
| 2014 | $3,936 | $151,330 | $0 | $151,330 |
Landlord's Agent in 2025
Mary Phelps
William Pitt
(203) 546-0315
48 in this area
109 Total Sales
Tenant's Agent in 2025
Amy Grossfeld
Houlihan Lawrence
(203) 470-6785
41 in this area
55 Total Sales
Source: SmartMLS
MLS Number: 24130901
APN: RIDG-000014-E000799
Disclaimer: Certain information contained herein is derived from information provided by parties other than Homes.com. All information provided is deemed reliable, but is not guaranteed to be accurate and should be independently verified.
![]() IDX information is provided exclusively for personal, non-commercial use, and may not be used for any purpose other than to identify prospective properties consumers may be interested in purchasing. Information is deemed reliable but not guaranteed.
IDX information is provided exclusively for personal, non-commercial use, and may not be used for any purpose other than to identify prospective properties consumers may be interested in purchasing. Information is deemed reliable but not guaranteed.
Ask me questions while you tour the home.