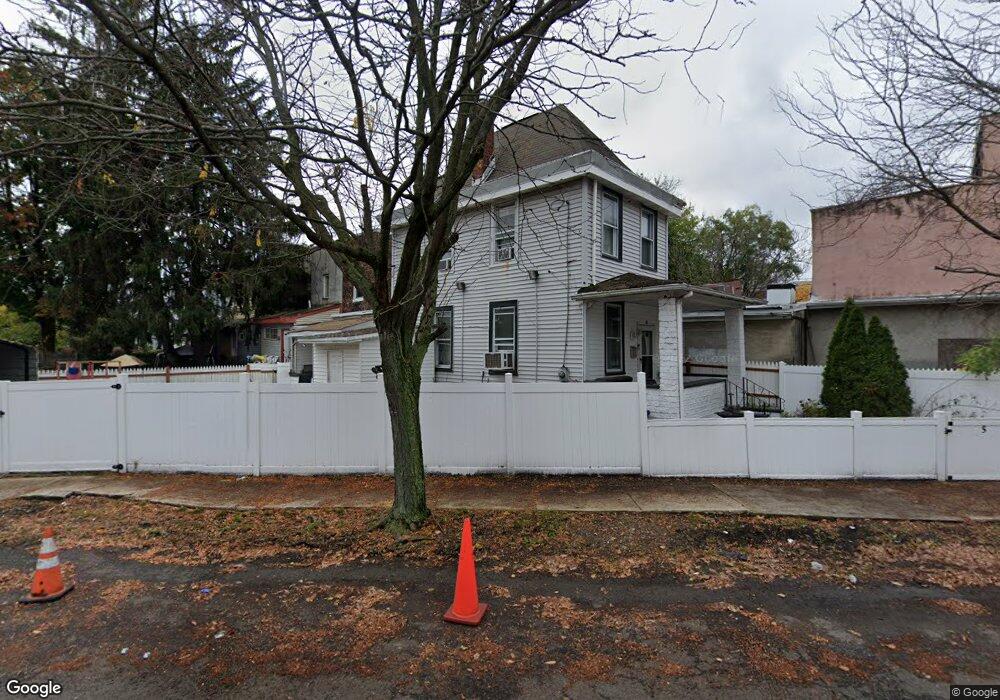
5 Stokely Ave Trenton, NJ 08611
South Trenton NeighborhoodEstimated Value: $157,265 - $195,000
2
Beds
1
Bath
896
Sq Ft
$198/Sq Ft
Est. Value
About This Home
This home is located at 5 Stokely Ave, Trenton, NJ 08611 and is currently estimated at $177,566, approximately $198 per square foot. 5 Stokely Ave is a home located in Mercer County with nearby schools including Mott Elementary School, Parker Elementary School, and Grace A Dunn Middle School.
Ownership History
Date
Name
Owned For
Owner Type
Purchase Details
Closed on
Sep 12, 2024
Sold by
Dejesus Victor
Bought by
Vz Associates Llc
Current Estimated Value
Purchase Details
Closed on
Jun 20, 2024
Sold by
Patel Ashutosh
Bought by
Dejesus Victor
Purchase Details
Closed on
Sep 19, 2016
Sold by
Rosario Ana
Bought by
Patel Ashutosn
Purchase Details
Closed on
Dec 1, 2004
Sold by
Jacobs Ross
Bought by
Rosario Ana
Home Financials for this Owner
Home Financials are based on the most recent Mortgage that was taken out on this home.
Original Mortgage
$73,359
Interest Rate
5.75%
Purchase Details
Closed on
Jul 31, 1998
Sold by
Vorona Pelogia
Bought by
Jacobs Ross
Home Financials for this Owner
Home Financials are based on the most recent Mortgage that was taken out on this home.
Original Mortgage
$16,000
Interest Rate
6.8%
Create a Home Valuation Report for This Property
The Home Valuation Report is an in-depth analysis detailing your home's value as well as a comparison with similar homes in the area
Home Values in the Area
Average Home Value in this Area
Purchase History
| Date | Buyer | Sale Price | Title Company |
|---|---|---|---|
| Vz Associates Llc | -- | Emerald Title | |
| Dejesus Victor | -- | Emerald Title | |
| Dejesus Victor | -- | Emerald Title | |
| Patel Ashutosn | $122,239 | None Available | |
| Rosario Ana | $77,220 | -- | |
| -- | $77,200 | -- | |
| Jacobs Ross | $20,000 | -- |
Source: Public Records
Mortgage History
| Date | Status | Borrower | Loan Amount |
|---|---|---|---|
| Previous Owner | -- | $73,359 | |
| Previous Owner | Jacobs Ross | $16,000 |
Source: Public Records
Tax History Compared to Growth
Tax History
| Year | Tax Paid | Tax Assessment Tax Assessment Total Assessment is a certain percentage of the fair market value that is determined by local assessors to be the total taxable value of land and additions on the property. | Land | Improvement |
|---|---|---|---|---|
| 2025 | $2,506 | $43,200 | $8,400 | $34,800 |
| 2024 | $2,405 | $43,200 | $8,400 | $34,800 |
| 2023 | $2,405 | $43,200 | $8,400 | $34,800 |
| 2022 | $2,358 | $43,200 | $8,400 | $34,800 |
| 2021 | $2,399 | $43,200 | $8,400 | $34,800 |
| 2020 | $2,391 | $43,200 | $8,400 | $34,800 |
| 2019 | $2,353 | $43,200 | $8,400 | $34,800 |
| 2018 | $2,252 | $43,200 | $8,400 | $34,800 |
| 2017 | $2,141 | $43,200 | $8,400 | $34,800 |
| 2016 | $2,491 | $43,300 | $18,500 | $24,800 |
| 2015 | $2,482 | $43,300 | $18,500 | $24,800 |
| 2014 | $2,471 | $43,300 | $18,500 | $24,800 |
Source: Public Records
Map
Nearby Homes