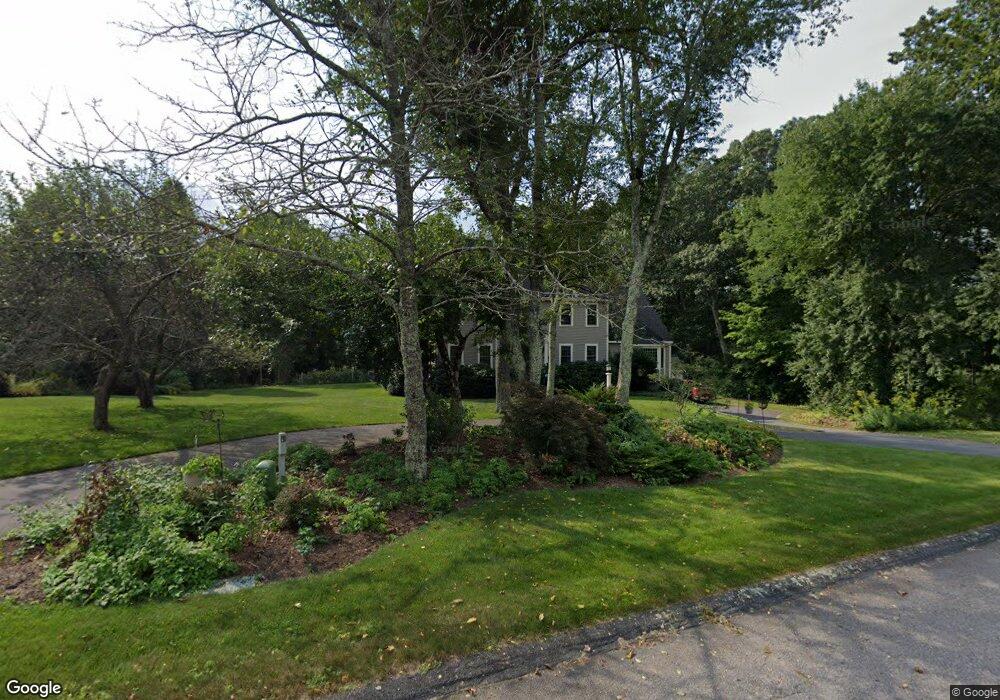
5 Stone End Rd Medway, MA 02053
Estimated Value: $801,915 - $934,000
4
Beds
3
Baths
3,082
Sq Ft
$285/Sq Ft
Est. Value
About This Home
This home is located at 5 Stone End Rd, Medway, MA 02053 and is currently estimated at $878,729, approximately $285 per square foot. 5 Stone End Rd is a home located in Norfolk County with nearby schools including John D. McGovern Elementary School, Burke-Memorial Elementary, and Medway Middle School.
Ownership History
Date
Name
Owned For
Owner Type
Purchase Details
Closed on
Nov 21, 2011
Sold by
Chang Bang and Qin Letao
Bought by
Finnegan Mark A and Briggs Karen L
Current Estimated Value
Home Financials for this Owner
Home Financials are based on the most recent Mortgage that was taken out on this home.
Original Mortgage
$300,000
Outstanding Balance
$203,581
Interest Rate
3.92%
Mortgage Type
Purchase Money Mortgage
Estimated Equity
$675,148
Purchase Details
Closed on
Aug 4, 2000
Sold by
Wilson Robert D and Wilson Elizabeth C
Bought by
Whittemore William M and Whittemore Kim L
Home Financials for this Owner
Home Financials are based on the most recent Mortgage that was taken out on this home.
Original Mortgage
$292,000
Interest Rate
8.1%
Mortgage Type
Purchase Money Mortgage
Create a Home Valuation Report for This Property
The Home Valuation Report is an in-depth analysis detailing your home's value as well as a comparison with similar homes in the area
Home Values in the Area
Average Home Value in this Area
Purchase History
| Date | Buyer | Sale Price | Title Company |
|---|---|---|---|
| Finnegan Mark A | $445,000 | -- | |
| Whittemore William M | $370,000 | -- |
Source: Public Records
Mortgage History
| Date | Status | Borrower | Loan Amount |
|---|---|---|---|
| Open | Finnegan Mark A | $300,000 | |
| Previous Owner | Whittemore William M | $292,000 |
Source: Public Records
Tax History
| Year | Tax Paid | Tax Assessment Tax Assessment Total Assessment is a certain percentage of the fair market value that is determined by local assessors to be the total taxable value of land and additions on the property. | Land | Improvement |
|---|---|---|---|---|
| 2025 | $9,827 | $689,600 | $344,000 | $345,600 |
| 2024 | $9,930 | $689,600 | $344,000 | $345,600 |
| 2023 | $9,888 | $620,300 | $313,500 | $306,800 |
| 2022 | $8,800 | $519,800 | $232,900 | $286,900 |
| 2021 | $8,864 | $507,700 | $217,600 | $290,100 |
| 2020 | $8,680 | $496,000 | $217,600 | $278,400 |
| 2019 | $8,190 | $482,600 | $208,900 | $273,700 |
| 2018 | $8,245 | $466,900 | $200,200 | $266,700 |
| 2017 | $8,121 | $453,200 | $195,900 | $257,300 |
| 2016 | $7,930 | $437,900 | $180,600 | $257,300 |
| 2015 | $7,841 | $429,900 | $178,400 | $251,500 |
| 2014 | $7,856 | $417,000 | $182,600 | $234,400 |
Source: Public Records
Map
Nearby Homes
- 8 Liberty Rd
- 23 Cedar Farms Rd
- 56 Fisher St
- 3 Nobscott Rd
- 15 Fox Run Rd
- 22 Granite St
- 190-194 E Main St
- 45 Wendy Ln
- 4 Waterfall Ln
- 6 Kingson Ln Unit 2
- 39 West St
- 2 Kingson Ln Unit 2
- 4 Bullard Cir
- 6 Freedom Trail
- 3 Thayer Rd
- 50 Morgans Way
- 35 Woodland Ave Unit 35A
- 15 Black Bear Cir Unit 15
- 16 Oak Tree Dr
- 13 Black Bear Cir Unit 13
Your Personal Tour Guide
Ask me questions while you tour the home.