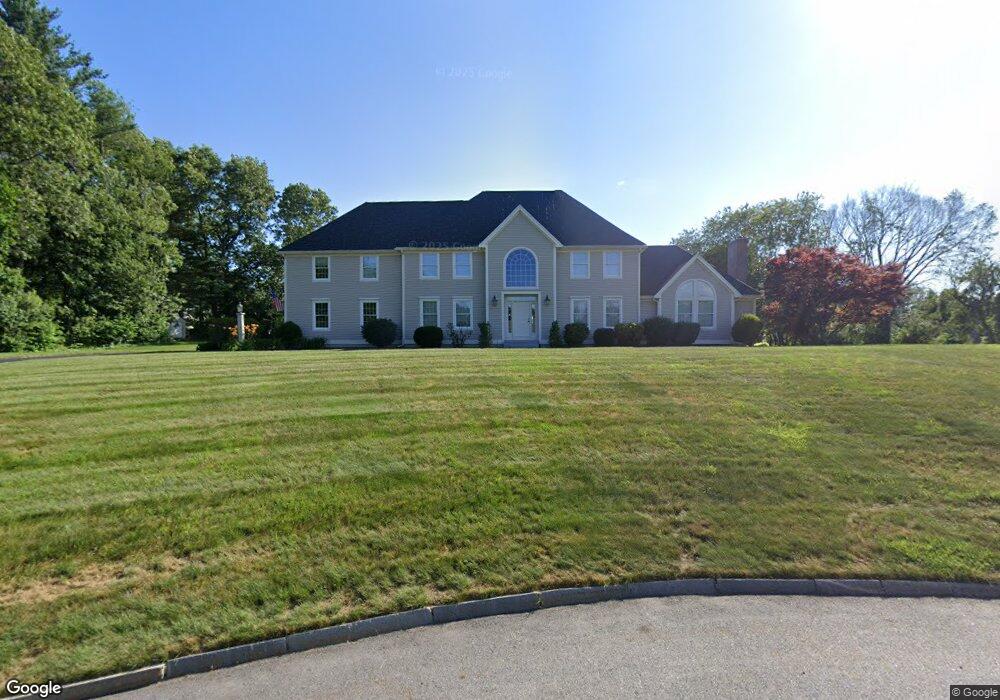
5 Swanson Ln Westford, MA 01886
Estimated Value: $1,398,103 - $1,523,000
4
Beds
4
Baths
3,908
Sq Ft
$374/Sq Ft
Est. Value
About This Home
This home is located at 5 Swanson Ln, Westford, MA 01886 and is currently estimated at $1,460,026, approximately $373 per square foot. 5 Swanson Ln is a home located in Middlesex County with nearby schools including Nabnasset Elementary, Abbot Elementary School, and Stony Brook School.
Ownership History
Date
Name
Owned For
Owner Type
Purchase Details
Closed on
Oct 30, 2023
Sold by
Cannellos Stephan G and Cannellos Jeanne S
Bought by
Stephan G Cannellos T G and Stephan Cannellos
Current Estimated Value
Purchase Details
Closed on
Feb 24, 1998
Sold by
Wescon Inc
Bought by
Cannellos Stephen G and Cannellos Jeanne S
Home Financials for this Owner
Home Financials are based on the most recent Mortgage that was taken out on this home.
Original Mortgage
$333,000
Interest Rate
6.9%
Mortgage Type
Purchase Money Mortgage
Create a Home Valuation Report for This Property
The Home Valuation Report is an in-depth analysis detailing your home's value as well as a comparison with similar homes in the area
Home Values in the Area
Average Home Value in this Area
Purchase History
| Date | Buyer | Sale Price | Title Company |
|---|---|---|---|
| Stephan G Cannellos T G | -- | None Available | |
| Cannellos Stephen G | $536,100 | -- |
Source: Public Records
Mortgage History
| Date | Status | Borrower | Loan Amount |
|---|---|---|---|
| Previous Owner | Cannellos Stephen G | $240,000 | |
| Previous Owner | Cannellos Stephen G | $333,000 |
Source: Public Records
Tax History Compared to Growth
Tax History
| Year | Tax Paid | Tax Assessment Tax Assessment Total Assessment is a certain percentage of the fair market value that is determined by local assessors to be the total taxable value of land and additions on the property. | Land | Improvement |
|---|---|---|---|---|
| 2025 | $17,359 | $1,288,700 | $375,300 | $913,400 |
| 2024 | $17,532 | $1,273,200 | $367,800 | $905,400 |
| 2023 | $16,178 | $1,096,100 | $350,900 | $745,200 |
| 2022 | $16,768 | $1,040,200 | $314,100 | $726,100 |
| 2021 | $15,477 | $930,100 | $314,100 | $616,000 |
| 2020 | $15,257 | $934,300 | $314,100 | $620,200 |
| 2019 | $14,727 | $889,300 | $314,100 | $575,200 |
| 2018 | $14,227 | $879,300 | $304,100 | $575,200 |
| 2017 | $13,451 | $819,700 | $304,100 | $515,600 |
| 2016 | $13,192 | $809,300 | $290,700 | $518,600 |
| 2015 | $14,361 | $884,300 | $280,600 | $603,700 |
| 2014 | $13,692 | $824,800 | $271,400 | $553,400 |
Source: Public Records
Map
Nearby Homes