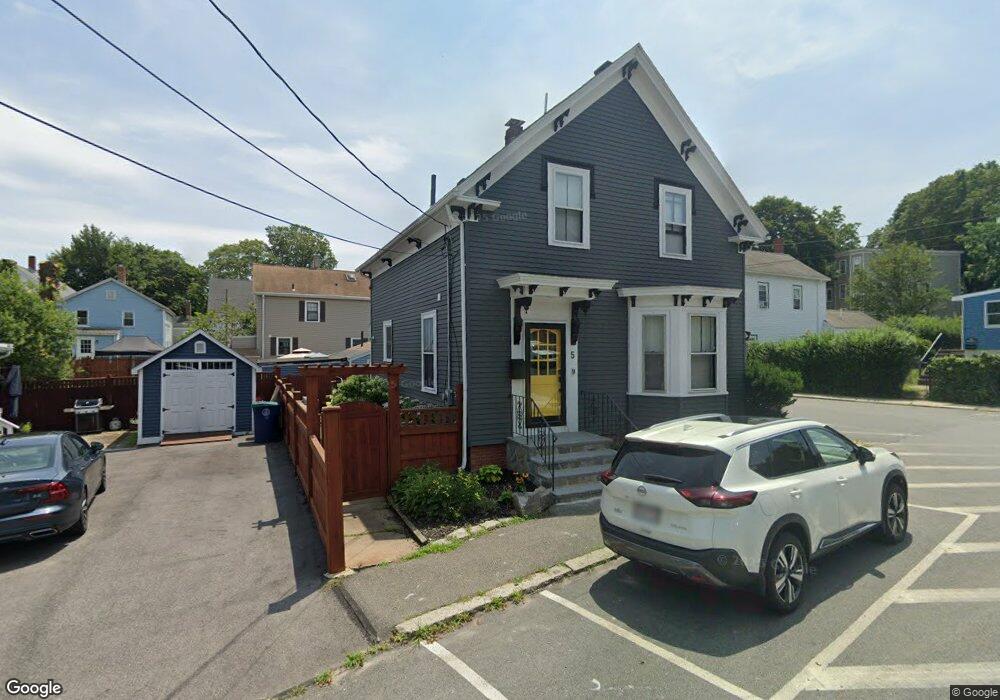
5 Symonds St Salem, MA 01970
North Salem NeighborhoodEstimated Value: $626,000 - $787,000
2
Beds
1
Bath
1,400
Sq Ft
$489/Sq Ft
Est. Value
About This Home
This home is located at 5 Symonds St, Salem, MA 01970 and is currently estimated at $685,209, approximately $489 per square foot. 5 Symonds St is a home located in Essex County with nearby schools including Bates Elementary School, Saltonstall School, and Carlton Elementary School.
Ownership History
Date
Name
Owned For
Owner Type
Purchase Details
Closed on
Aug 12, 2022
Sold by
Johnson Matthew E and Johnson Michelle T
Bought by
Baldassare Peter and Johnson Makaylah
Current Estimated Value
Home Financials for this Owner
Home Financials are based on the most recent Mortgage that was taken out on this home.
Original Mortgage
$542,450
Outstanding Balance
$516,638
Interest Rate
5.7%
Mortgage Type
Purchase Money Mortgage
Estimated Equity
$168,571
Purchase Details
Closed on
Feb 14, 2014
Sold by
Bacigalupo Nancy A
Bought by
Johnson Matthew E and Johnson Michelle T
Home Financials for this Owner
Home Financials are based on the most recent Mortgage that was taken out on this home.
Original Mortgage
$230,278
Interest Rate
4.52%
Mortgage Type
New Conventional
Purchase Details
Closed on
Oct 31, 1995
Sold by
Rocci Patricia A
Bought by
Bacigalpo Nancy A
Purchase Details
Closed on
May 29, 1990
Sold by
Pydynkowski John F
Bought by
Pydynkowski Patricia A
Create a Home Valuation Report for This Property
The Home Valuation Report is an in-depth analysis detailing your home's value as well as a comparison with similar homes in the area
Home Values in the Area
Average Home Value in this Area
Purchase History
| Date | Buyer | Sale Price | Title Company |
|---|---|---|---|
| Baldassare Peter | $571,000 | None Available | |
| Johnson Matthew E | $237,400 | -- | |
| Bacigalpo Nancy A | $85,000 | -- | |
| Bacigalpo Nancy A | $85,000 | -- | |
| Pydynkowski Patricia A | $45,000 | -- | |
| Pydynkowski Patricia A | $45,000 | -- |
Source: Public Records
Mortgage History
| Date | Status | Borrower | Loan Amount |
|---|---|---|---|
| Open | Baldassare Peter | $542,450 | |
| Closed | Baldassare Peter | $542,450 | |
| Previous Owner | Johnson Matthew E | $230,278 | |
| Previous Owner | Pydynkowski Patricia A | $180,000 |
Source: Public Records
Tax History
| Year | Tax Paid | Tax Assessment Tax Assessment Total Assessment is a certain percentage of the fair market value that is determined by local assessors to be the total taxable value of land and additions on the property. | Land | Improvement |
|---|---|---|---|---|
| 2025 | $6,780 | $597,900 | $189,000 | $408,900 |
| 2024 | $6,570 | $565,400 | $179,600 | $385,800 |
| 2023 | $4,960 | $396,500 | $165,800 | $230,700 |
| 2022 | $4,906 | $370,300 | $160,200 | $210,100 |
| 2021 | $4,823 | $349,500 | $149,200 | $200,300 |
| 2020 | $4,651 | $321,900 | $140,900 | $181,000 |
| 2019 | $4,622 | $306,100 | $133,700 | $172,400 |
| 2018 | $4,474 | $290,900 | $127,100 | $163,800 |
| 2017 | $4,143 | $261,200 | $107,200 | $154,000 |
| 2016 | $4,015 | $256,200 | $102,200 | $154,000 |
| 2015 | $3,911 | $238,300 | $93,900 | $144,400 |
Source: Public Records
Map
Nearby Homes
- 40 Buffum St Unit 2
- 40 Buffum St Unit 1
- 21 Manning St
- 16 Oakland St
- 44 Orne St Unit 44
- 112 North St
- 3 S Mason St
- 9 Highland St
- 41 Dearborn St
- 16 Franklin St Unit 2403
- 16 Franklin St Unit 1303
- 86 Flint St
- 16 River St
- 23 River St
- 30 Driscoll St
- 17 North St Unit 2
- 35 Flint St Unit 209
- 35 Flint St Unit 106
- 128 Boston St Unit 4
- 289 Essex St Unit 211
Your Personal Tour Guide
Ask me questions while you tour the home.