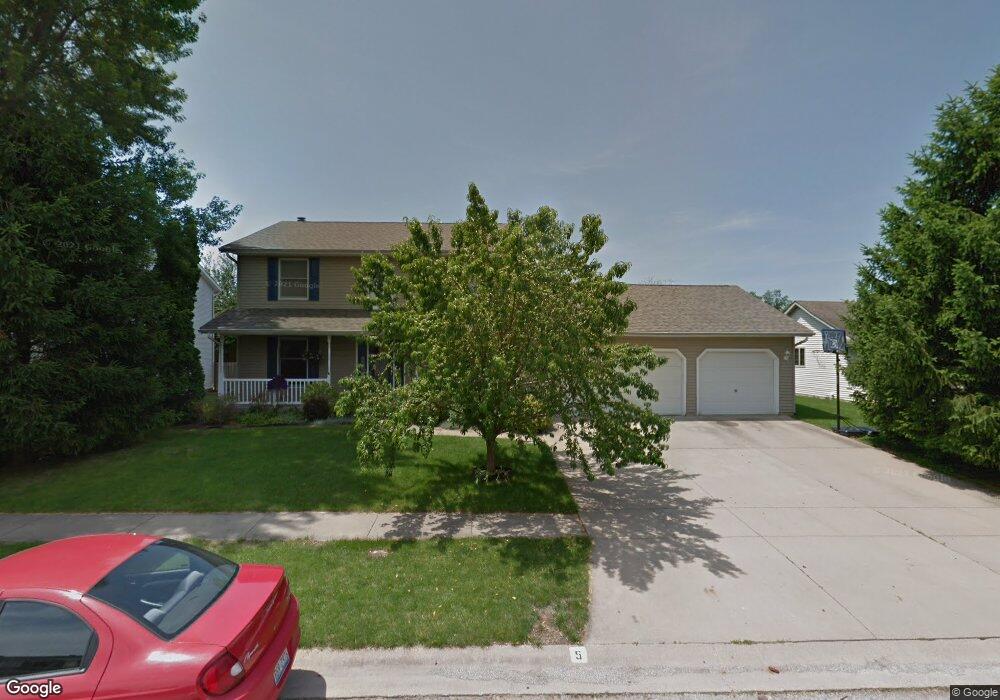
5 Taft Dr Unit 1 Rochester, IL 62563
Estimated Value: $345,559 - $375,000
4
Beds
3
Baths
3,040
Sq Ft
$119/Sq Ft
Est. Value
About This Home
This home is located at 5 Taft Dr Unit 1, Rochester, IL 62563 and is currently estimated at $362,640, approximately $119 per square foot. 5 Taft Dr Unit 1 is a home located in Sangamon County with nearby schools including Rochester Elementary Ec-1 School, Rochester Elementary School, and Rochester Intermediate School.
Ownership History
Date
Name
Owned For
Owner Type
Purchase Details
Closed on
Jul 2, 2005
Current Estimated Value
Purchase Details
Closed on
Mar 25, 2003
Purchase Details
Closed on
May 14, 1997
Create a Home Valuation Report for This Property
The Home Valuation Report is an in-depth analysis detailing your home's value as well as a comparison with similar homes in the area
Home Values in the Area
Average Home Value in this Area
Purchase History
| Date | Buyer | Sale Price | Title Company |
|---|---|---|---|
| -- | $175,500 | -- | |
| -- | $161,900 | -- | |
| -- | $154,000 | -- |
Source: Public Records
Tax History
| Year | Tax Paid | Tax Assessment Tax Assessment Total Assessment is a certain percentage of the fair market value that is determined by local assessors to be the total taxable value of land and additions on the property. | Land | Improvement |
|---|---|---|---|---|
| 2024 | $6,489 | $97,596 | $14,571 | $83,025 |
| 2023 | $6,355 | $92,701 | $13,840 | $78,861 |
| 2022 | $6,105 | $87,777 | $13,105 | $74,672 |
| 2021 | $5,854 | $84,272 | $12,582 | $71,690 |
| 2020 | $5,743 | $83,191 | $12,421 | $70,770 |
| 2019 | $5,641 | $83,735 | $12,502 | $71,233 |
| 2018 | $5,589 | $82,392 | $12,301 | $70,091 |
| 2017 | $5,500 | $81,520 | $12,171 | $69,349 |
| 2016 | $5,322 | $78,855 | $11,773 | $67,082 |
| 2015 | $4,087 | $61,702 | $11,996 | $49,706 |
| 2014 | $4,056 | $61,249 | $11,908 | $49,341 |
| 2013 | $3,993 | $60,546 | $11,771 | $48,775 |
Source: Public Records
Map
Nearby Homes
- 10 Lancelot Dr
- 35 Galahad Dr Unit 1
- 19 Circle Dr Unit 1
- 300 N Walnut St Unit 1
- 400 N Park St
- 328 Parkview Dr Unit 1
- 501 Sattley St Unit 1
- 536 Karen Rose Dr
- 139 Willow Rd Unit 1
- 0 Oak Hill Rd
- 53 Mishawaka Dr Unit 1
- 4 Riverwood Dr
- 8 Riverwood Dr
- 44 Woodland Trail
- 3725 Indian Grass Ln
- 2784 Hilltop Rd
- 3708 Switchgrass Ct
- 3804 Kerry Blvd
- 2632 Hilltop Rd
- 66 White Birch Rd
- 3 Taft Dr Unit 1
- 7 Taft Dr Unit 1
- 1 Taft Dr Unit 1
- 9 Taft Dr Unit 1
- 4 Taft Dr Unit 1
- 2 Taft Dr Unit 1
- 6 Taft Dr Unit 1
- 11 Taft Dr
- 8 Taft Dr Unit 1
- 67 Taft Dr Unit 1
- 13 Taft Dr Unit 1
- 10 Taft Dr Unit 1
- 72 Taft Dr Unit 1
- 70 Taft Dr Unit 1
- 14 Taft Dr Unit 1
- 65 Taft Dr Unit 1
- 15 Taft Dr Unit 1
- 100 Taft Dr Unit 1
- 68 Taft Dr Unit 1
- 66 Taft Dr Unit 1
Your Personal Tour Guide
Ask me questions while you tour the home.