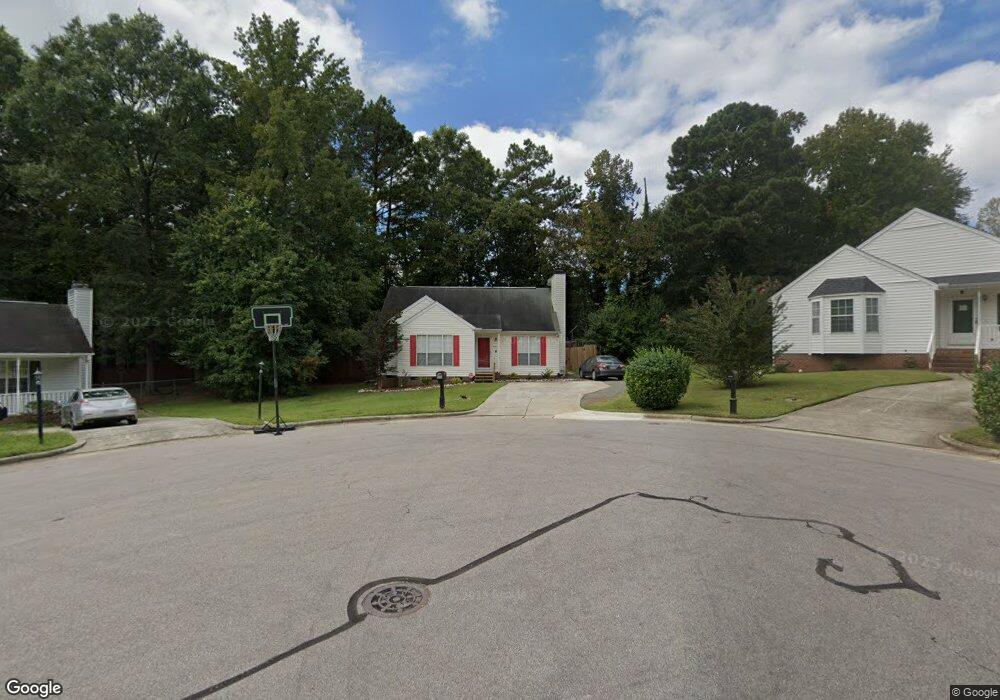
5 Thebes Place Durham, NC 27703
Eastern Durham NeighborhoodEstimated Value: $282,000 - $298,000
3
Beds
2
Baths
1,233
Sq Ft
$236/Sq Ft
Est. Value
About This Home
This home is located at 5 Thebes Place, Durham, NC 27703 and is currently estimated at $291,321, approximately $236 per square foot. 5 Thebes Place is a home located in Durham County with nearby schools including Glenn Elementary, John W Neal Middle School, and Southern School of Energy & Sustainability.
Ownership History
Date
Name
Owned For
Owner Type
Purchase Details
Closed on
Sep 14, 2017
Sold by
Thompson Michael A
Bought by
Sawyer Charles
Current Estimated Value
Home Financials for this Owner
Home Financials are based on the most recent Mortgage that was taken out on this home.
Original Mortgage
$144,000
Outstanding Balance
$122,501
Interest Rate
4.62%
Mortgage Type
Adjustable Rate Mortgage/ARM
Estimated Equity
$168,820
Purchase Details
Closed on
Mar 25, 2011
Sold by
Thompson Michael A and Thompson Wanda M
Bought by
Thompson Michael A
Purchase Details
Closed on
Sep 3, 2008
Sold by
Deutsche Bank National Trust Co
Bought by
Thompson Michael A and Thompson Wanda M
Home Financials for this Owner
Home Financials are based on the most recent Mortgage that was taken out on this home.
Original Mortgage
$91,300
Interest Rate
6.61%
Mortgage Type
Purchase Money Mortgage
Purchase Details
Closed on
Mar 4, 2008
Sold by
Carlisle Ii Joseph W
Bought by
Deutsche Bank National Trust Co and Noteholders Of Aames Mortgage Investment
Create a Home Valuation Report for This Property
The Home Valuation Report is an in-depth analysis detailing your home's value as well as a comparison with similar homes in the area
Home Values in the Area
Average Home Value in this Area
Purchase History
| Date | Buyer | Sale Price | Title Company |
|---|---|---|---|
| Sawyer Charles | $142,000 | None Available | |
| Thompson Michael A | -- | None Available | |
| Thompson Michael A | $90,000 | None Available | |
| Deutsche Bank National Trust Co | $93,500 | None Available |
Source: Public Records
Mortgage History
| Date | Status | Borrower | Loan Amount |
|---|---|---|---|
| Open | Sawyer Charles | $144,000 | |
| Previous Owner | Thompson Michael A | $91,300 |
Source: Public Records
Tax History Compared to Growth
Tax History
| Year | Tax Paid | Tax Assessment Tax Assessment Total Assessment is a certain percentage of the fair market value that is determined by local assessors to be the total taxable value of land and additions on the property. | Land | Improvement |
|---|---|---|---|---|
| 2025 | $2,837 | $286,165 | $61,815 | $224,350 |
| 2024 | $2,014 | $144,392 | $25,920 | $118,472 |
| 2023 | $1,891 | $144,392 | $25,920 | $118,472 |
| 2022 | $1,848 | $144,392 | $25,920 | $118,472 |
| 2021 | $1,839 | $144,392 | $25,920 | $118,472 |
| 2020 | $1,796 | $144,392 | $25,920 | $118,472 |
| 2019 | $1,796 | $144,392 | $25,920 | $118,472 |
| 2018 | $1,670 | $123,074 | $25,920 | $97,154 |
| 2017 | $1,657 | $123,074 | $25,920 | $97,154 |
| 2016 | $1,601 | $123,074 | $25,920 | $97,154 |
| 2015 | $1,704 | $123,100 | $27,166 | $95,934 |
| 2014 | $1,704 | $123,100 | $27,166 | $95,934 |
Source: Public Records
Map
Nearby Homes
- 10 Petersburg Place
- 9 Petersburg Place
- 3306 Woodland Park Rd
- 912 Obsidian Way
- 3602 Turquoise Dr
- 1011 Homecoming Way
- 3615 Freeman Rd
- 6 Fircrest Ct
- 903 Outlaw Ave Unit Homesite 21
- 2018 Cross Bones Blvd
- 2018 Cross Bones Blvd Unit 28
- 4 Hertford Place
- 1101 Shovelhead Dr Unit 51
- 0 Seford Dr
- 607 Chopper Ln Unit Homesite 9
- 3507 Portico Ln
- 1103 Kindness Ln
- 1143 Sweet Cream Ct
- 1007 Shovelhead Dr Unit 4
- 322+326 Chandler Rd
- 7 Thebes Place
- 3 Thebes Place
- 600 Clayton Rd
- 4 Newland Place
- 6 Newland Place
- 574 Clayton Rd
- 608 Clayton Rd
- 6 Thebes Place
- 570 Clayton Rd
- 707 Greyson Dr
- 4 Thebes Place
- 2 Newland Place
- 610 Clayton Rd
- 705 Greyson Dr Unit 2356124-1092
- 705 Greyson Dr
- 711 Greyson Dr
- 5 Newland Place
- 566 Clayton Rd
- 11 Oakside Ct
- 13 Oakside Ct