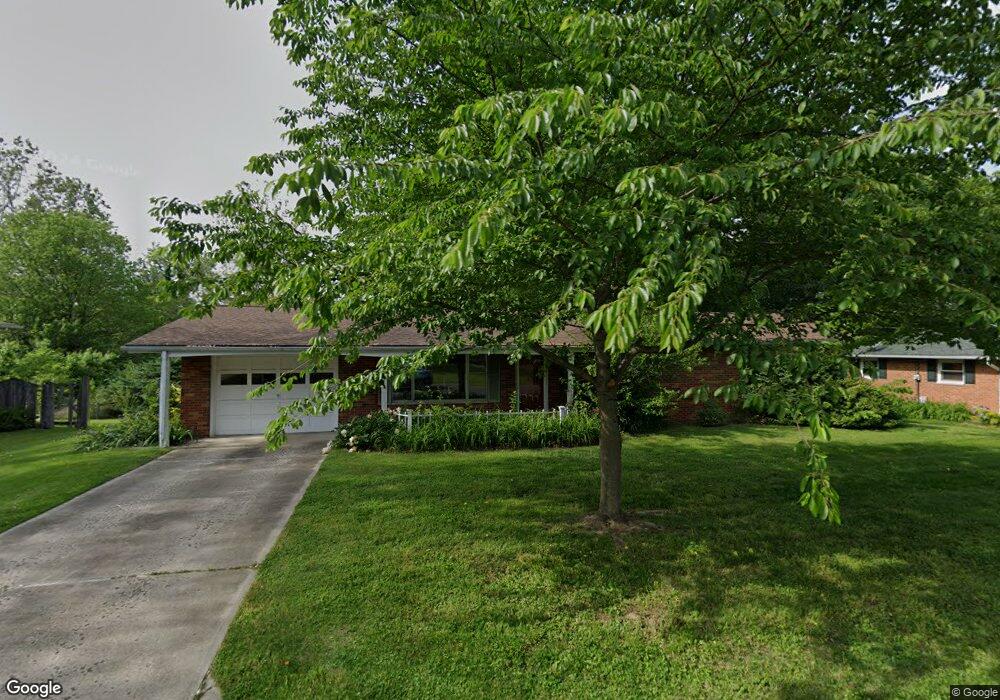
5 Tiemann Dr Collinsville, IL 62234
Estimated Value: $209,000 - $230,577
3
Beds
2
Baths
1,352
Sq Ft
$165/Sq Ft
Est. Value
About This Home
This home is located at 5 Tiemann Dr, Collinsville, IL 62234 and is currently estimated at $222,894, approximately $164 per square foot. 5 Tiemann Dr is a home located in Madison County with nearby schools including John A Renfro Elementary School, Dorris Intermediate School, and Collinsville Middle School.
Ownership History
Date
Name
Owned For
Owner Type
Purchase Details
Closed on
Dec 5, 2018
Sold by
Gardiner Kathryn L
Bought by
Gardiner Amy M and Gardiner Woodrow D
Current Estimated Value
Purchase Details
Closed on
Jul 3, 2017
Sold by
Gardiner John W and Gardiner Kathryn L
Bought by
Gardiner Kathryn L
Purchase Details
Closed on
Apr 29, 2014
Sold by
Collins David W and Collins Emily B
Bought by
Gardiner John W and Gardiner Kathryn L
Home Financials for this Owner
Home Financials are based on the most recent Mortgage that was taken out on this home.
Original Mortgage
$93,750
Outstanding Balance
$27,805
Interest Rate
3.62%
Mortgage Type
New Conventional
Estimated Equity
$195,089
Purchase Details
Closed on
Apr 9, 2004
Sold by
Haynes Dianne E
Bought by
Collins David W and Collins Emily B
Home Financials for this Owner
Home Financials are based on the most recent Mortgage that was taken out on this home.
Original Mortgage
$95,120
Interest Rate
3.15%
Mortgage Type
Purchase Money Mortgage
Create a Home Valuation Report for This Property
The Home Valuation Report is an in-depth analysis detailing your home's value as well as a comparison with similar homes in the area
Home Values in the Area
Average Home Value in this Area
Purchase History
| Date | Buyer | Sale Price | Title Company |
|---|---|---|---|
| Gardiner Amy M | -- | None Available | |
| Gardiner Kathryn L | -- | -- | |
| Gardiner John W | $125,000 | Abstracts & Titles Inc | |
| Collins David W | $119,000 | Abstracts & Titles Inc |
Source: Public Records
Mortgage History
| Date | Status | Borrower | Loan Amount |
|---|---|---|---|
| Open | Gardiner John W | $93,750 | |
| Previous Owner | Collins David W | $95,120 | |
| Closed | Collins David W | $23,780 |
Source: Public Records
Tax History Compared to Growth
Tax History
| Year | Tax Paid | Tax Assessment Tax Assessment Total Assessment is a certain percentage of the fair market value that is determined by local assessors to be the total taxable value of land and additions on the property. | Land | Improvement |
|---|---|---|---|---|
| 2024 | $3,479 | $62,390 | $15,510 | $46,880 |
| 2023 | $3,479 | $57,750 | $14,360 | $43,390 |
| 2022 | $3,298 | $53,400 | $13,280 | $40,120 |
| 2021 | $2,882 | $49,240 | $12,220 | $37,020 |
| 2020 | $2,775 | $46,980 | $11,660 | $35,320 |
| 2019 | $2,698 | $45,370 | $11,260 | $34,110 |
| 2018 | $2,638 | $42,980 | $10,670 | $32,310 |
| 2017 | $2,789 | $44,140 | $10,470 | $33,670 |
| 2016 | $2,948 | $44,140 | $10,470 | $33,670 |
| 2015 | $2,741 | $42,990 | $10,200 | $32,790 |
| 2014 | $2,741 | $42,990 | $10,200 | $32,790 |
| 2013 | $2,741 | $42,990 | $10,200 | $32,790 |
Source: Public Records
Map
Nearby Homes
- 10 White Lily Dr
- 0 N Keebler Ave
- 625 W Country Ln
- 203 Greenfield Dr
- 414 Bunker Hill Dr
- 2 Chelsea Rd
- 1224 Cedar Ridge Ct
- 102 Toni Ct
- 22 Brookwood Dr
- 5 Brookwood Dr
- 1120 Williams St
- 706 Illinois Ave
- 1210 Constance St
- 308 Brown Ave
- 1227 Ridge Ave
- 300 Pine Lake Rd Unit 6
- 300 Pine Lake Rd Unit 7
- 2007 Belt Line Rd
- 617 N Morrison Ave
- 54 Oak Leaf Dr