Estimated Value: $358,000 - $410,000
3
Beds
2
Baths
1,800
Sq Ft
$216/Sq Ft
Est. Value
About This Home
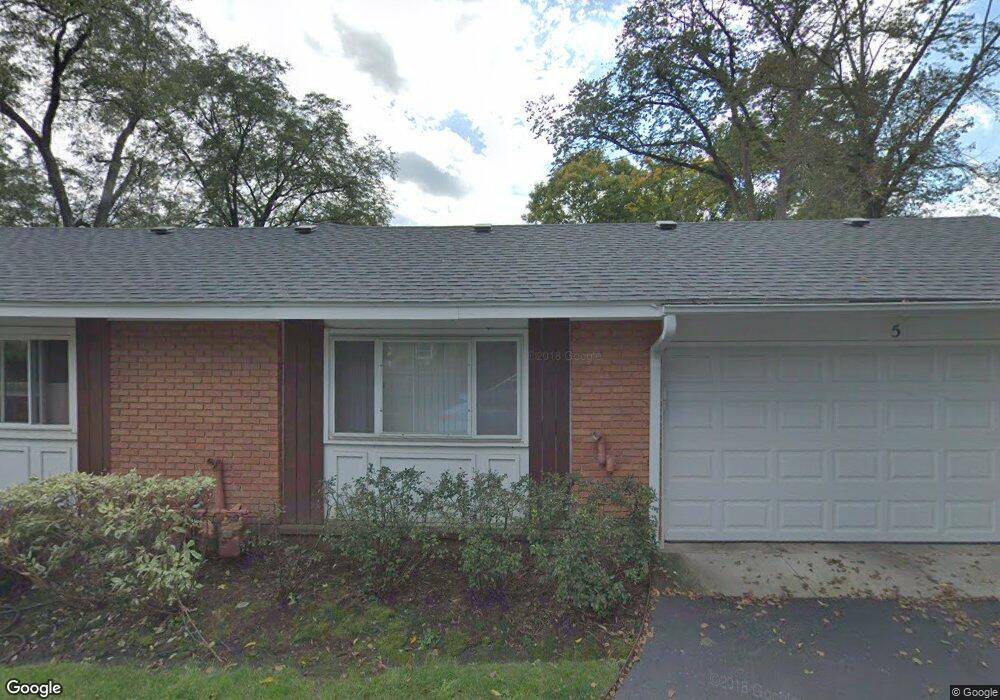
This home is located at 5 Tory Ln, Rolling Meadows, IL 60008 and is currently estimated at $388,591, approximately $215 per square foot. 5 Tory Ln is a home located in Cook County with nearby schools including Central Road Elementary School, Plum Grove Jr High School, and William Fremd High School.
Ownership History
Date
Name
Owned For
Owner Type
Purchase Details
Closed on
Oct 14, 2014
Sold by
Atherton Mary Anne and Atherton William D
Bought by
Atherton Mary Anne and Mary Anne Atherton Revocable Living Trus
Current Estimated Value
Purchase Details
Closed on
May 22, 2013
Sold by
Pufpaf Mary Anne and Atherton William D
Bought by
Pufpaf Mary Anne and Atherton Willliam D
Purchase Details
Closed on
Mar 22, 2012
Sold by
Kaye Bruce K
Bought by
Pufpaf Mary Anne
Home Financials for this Owner
Home Financials are based on the most recent Mortgage that was taken out on this home.
Original Mortgage
$161,000
Outstanding Balance
$109,552
Interest Rate
3.9%
Mortgage Type
New Conventional
Estimated Equity
$279,039
Purchase Details
Closed on
Dec 16, 2004
Sold by
Cappon Jerome J and Cappon Janet V
Bought by
Kaye Bruce K
Home Financials for this Owner
Home Financials are based on the most recent Mortgage that was taken out on this home.
Original Mortgage
$160,000
Interest Rate
5.9%
Mortgage Type
Unknown
Create a Home Valuation Report for This Property
The Home Valuation Report is an in-depth analysis detailing your home's value as well as a comparison with similar homes in the area
Home Values in the Area
Average Home Value in this Area
Purchase History
| Date | Buyer | Sale Price | Title Company |
|---|---|---|---|
| Atherton Mary Anne | -- | None Available | |
| Pufpaf Mary Anne | -- | None Available | |
| Pufpaf Mary Anne | $216,000 | Prairie Title | |
| Kaye Bruce K | $260,000 | Pntn |
Source: Public Records
Mortgage History
| Date | Status | Borrower | Loan Amount |
|---|---|---|---|
| Open | Pufpaf Mary Anne | $161,000 | |
| Previous Owner | Kaye Bruce K | $160,000 |
Source: Public Records
Tax History
| Year | Tax Paid | Tax Assessment Tax Assessment Total Assessment is a certain percentage of the fair market value that is determined by local assessors to be the total taxable value of land and additions on the property. | Land | Improvement |
|---|---|---|---|---|
| 2025 | $6,325 | $33,225 | $4,832 | $28,393 |
| 2024 | $6,325 | $26,001 | $5,999 | $20,002 |
| 2023 | $6,487 | $27,499 | $5,999 | $21,500 |
| 2022 | $6,487 | $27,499 | $5,999 | $21,500 |
| 2021 | $5,108 | $20,937 | $3,261 | $17,676 |
| 2020 | $5,165 | $20,937 | $3,261 | $17,676 |
| 2019 | $5,990 | $23,238 | $3,261 | $19,977 |
| 2018 | $5,268 | $19,171 | $2,899 | $16,272 |
| 2017 | $5,616 | $20,500 | $2,899 | $17,601 |
| 2016 | $6,274 | $23,050 | $2,899 | $20,151 |
| 2015 | $6,012 | $21,048 | $2,657 | $18,391 |
| 2014 | $5,899 | $21,048 | $2,657 | $18,391 |
| 2013 | $6,554 | $21,048 | $2,657 | $18,391 |
Source: Public Records
Map
Nearby Homes
- 2 Croydon on Duxbury
- 4406 Euclid Ave Unit 2C
- 2 Stuart on Oxford
- 1 Harrogate on Oxford
- 304 E Tall Trees Ln
- 4704 Euclid Ave Unit 1B
- 4704 Euclid Ave Unit 47042D
- 2650 Brookwood Way Dr Unit 313
- 2650 Brookwood Way Dr Unit 108
- 2600 Brookwood Way Dr Unit 316
- 2600 Brookwood Way Dr Unit 305
- 2401 Rohlwing Rd
- 3000 California Ave
- 876 S Plum Grove Rd Unit 208
- 3 Holyoke on Auburn
- 16 W Fern Ct Unit 103A
- 123 Honeysuckle Ct
- 712-724 S Plum Grove Rd
- 112 Ironwood Ct
- 724 S Plum Grove Rd
Your Personal Tour Guide
Ask me questions while you tour the home.