Estimated Value: $260,000 - $276,089
3
Beds
2
Baths
1,753
Sq Ft
$153/Sq Ft
Est. Value
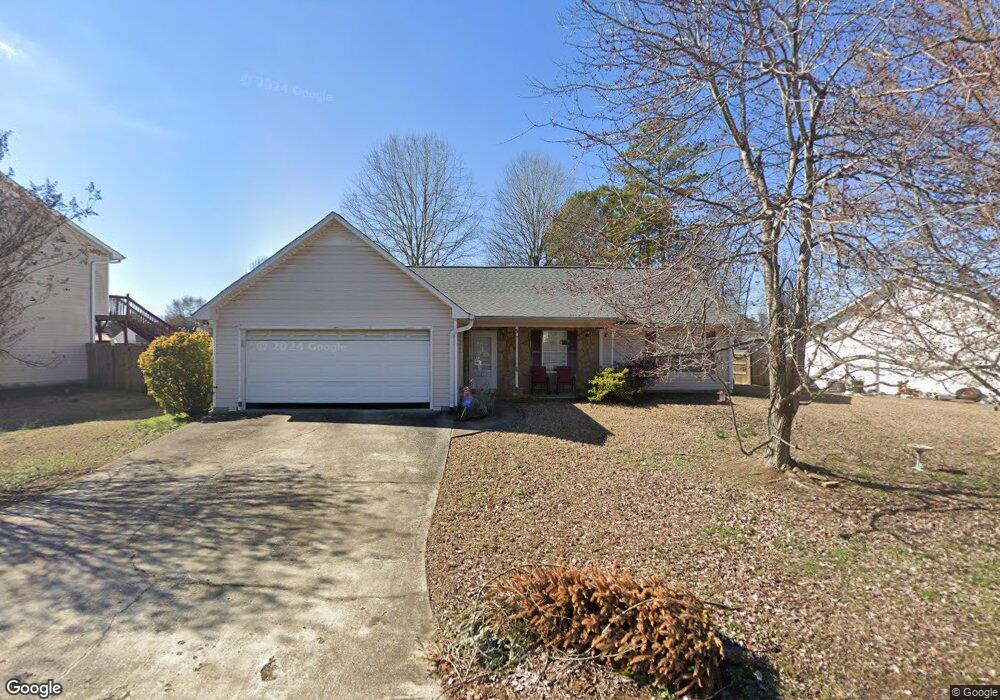
About This Home
This home is located at 5 Trillium Trail NE, Rome, GA 30165 and is currently estimated at $268,272, approximately $153 per square foot. 5 Trillium Trail NE is a home located in Floyd County with nearby schools including Armuchee Middle School, Armuchee High School, and Unity Christian School.
Ownership History
Date
Name
Owned For
Owner Type
Purchase Details
Closed on
Apr 15, 2011
Sold by
Thomas Roy Joe
Bought by
Lovelace Laura
Current Estimated Value
Home Financials for this Owner
Home Financials are based on the most recent Mortgage that was taken out on this home.
Original Mortgage
$95,505
Outstanding Balance
$65,736
Interest Rate
4.75%
Mortgage Type
FHA
Estimated Equity
$202,536
Purchase Details
Closed on
Jan 15, 2010
Sold by
Brown John
Bought by
Thomas Roy Joe
Purchase Details
Closed on
Feb 2, 2007
Sold by
Not Provided
Bought by
Lovelace Laura and Lovelace Joshua
Purchase Details
Closed on
Apr 15, 2004
Sold by
Smith Steven L
Bought by
Thomas Roy Joe
Purchase Details
Closed on
Sep 28, 2001
Sold by
A W Landscape Construction Inc
Bought by
Smith Steven L
Purchase Details
Closed on
Apr 20, 2001
Sold by
27 East Llc
Bought by
A W Landscape Construction Inc
Purchase Details
Closed on
Apr 23, 1998
Bought by
27 East Llc
Create a Home Valuation Report for This Property
The Home Valuation Report is an in-depth analysis detailing your home's value as well as a comparison with similar homes in the area
Home Values in the Area
Average Home Value in this Area
Purchase History
| Date | Buyer | Sale Price | Title Company |
|---|---|---|---|
| Lovelace Laura | $98,000 | -- | |
| Thomas Roy Joe | -- | -- | |
| Lovelace Laura | $139,000 | -- | |
| Thomas Roy Joe | $125,000 | -- | |
| Smith Steven L | $114,900 | -- | |
| A W Landscape Construction Inc | $23,000 | -- | |
| 27 East Llc | -- | -- |
Source: Public Records
Mortgage History
| Date | Status | Borrower | Loan Amount |
|---|---|---|---|
| Open | Thomas Roy Joe | $95,505 |
Source: Public Records
Tax History Compared to Growth
Tax History
| Year | Tax Paid | Tax Assessment Tax Assessment Total Assessment is a certain percentage of the fair market value that is determined by local assessors to be the total taxable value of land and additions on the property. | Land | Improvement |
|---|---|---|---|---|
| 2024 | $2,218 | $102,114 | $10,080 | $92,034 |
| 2023 | $2,052 | $89,745 | $10,080 | $79,665 |
| 2022 | $1,876 | $76,981 | $9,600 | $67,381 |
| 2021 | $1,609 | $60,824 | $9,600 | $51,224 |
| 2020 | $1,537 | $56,492 | $9,600 | $46,892 |
| 2019 | $1,486 | $54,769 | $9,600 | $45,169 |
| 2018 | $1,410 | $50,561 | $9,600 | $40,961 |
| 2017 | $1,332 | $46,151 | $9,600 | $36,551 |
| 2016 | $1,305 | $44,080 | $9,600 | $34,480 |
| 2015 | $1,281 | $44,080 | $9,600 | $34,480 |
| 2014 | $1,281 | $44,080 | $9,600 | $34,480 |
Source: Public Records
Map
Nearby Homes
- 3 Coggins Place NE
- 3 Coggins Place NE
- 7 Coggins Place NE
- KERRY Plan at Northberry
- BELHAVEN Plan at Northberry
- CALI Plan at Northberry
- ROBIE Plan at Northberry
- ARIA Plan at Northberry
- 9 Coggins Place NE
- 8 Coggins Place NE
- 11 Coggins Place NE
- 5 Coggins Place NE
- 10 Coggins Place NE
- 12 Coggins Place NE
- 13 Coggins Place NE
- 15 Coggins Place NE
- 21 Coggins Place NE
- 27 Coggins Place NE
- 7 Trillium Trail NE
- 3 Trillium Trail NE
- 6 Redfern Trail NE Unit 73
- 6 Redfern Trail NE
- 11 Trillium Trail NE
- 1 Trillium Trail NE
- 8 Redfern Trail NE
- 10 Trillium Trail NE
- 13 Trillium Trail NE
- 6 Trillium Trail NE
- 12 Trillium Trail NE
- 4 Trillium Trail NE Unit 53
- 4 Trillium Trail NE Unit 21
- 4 Trillium Trail NE
- 0 Bob White Ct NE
- 10 Redfern Trail NE
- 14 Trillium Trail NE
- 2 Trillium Trail NE
- 4 Bob White Ct NE
- 15 Trillium Trail NE