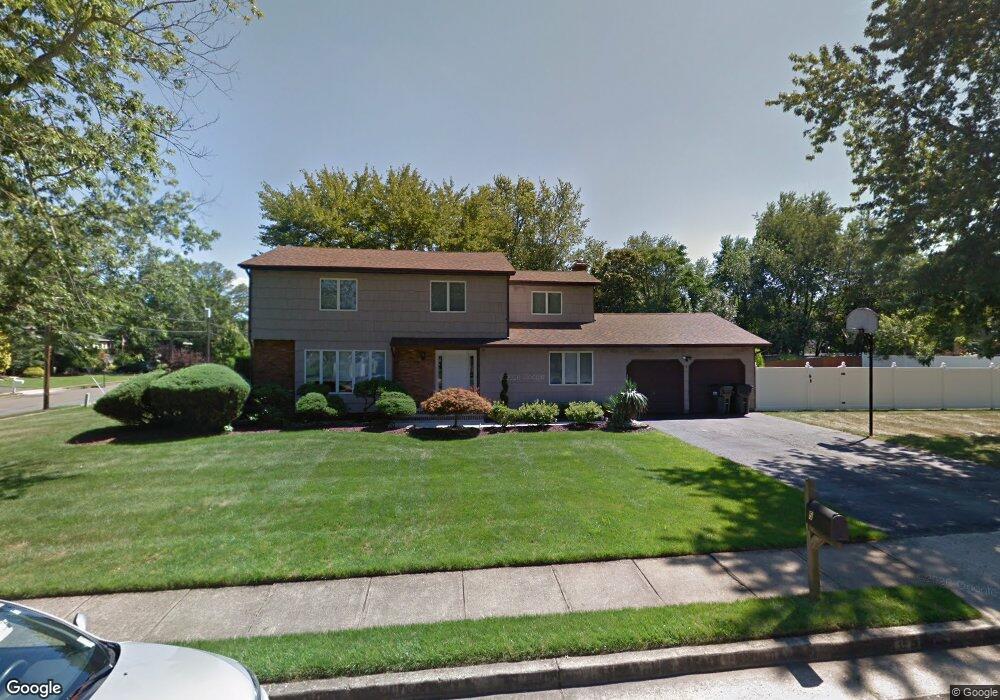
5 Trudeau Ct Marlboro, NJ 07746
Estimated Value: $828,210 - $934,000
4
Beds
3
Baths
2,292
Sq Ft
$379/Sq Ft
Est. Value
About This Home
This home is located at 5 Trudeau Ct, Marlboro, NJ 07746 and is currently estimated at $868,803, approximately $379 per square foot. 5 Trudeau Ct is a home located in Monmouth County with nearby schools including Asher Holmes Elementary School, Marlboro Middle School, and Marlboro High School.
Ownership History
Date
Name
Owned For
Owner Type
Purchase Details
Closed on
Sep 29, 2010
Sold by
Sacks Sandra C
Bought by
Greenberg Bradley and Greenberg Shara
Current Estimated Value
Home Financials for this Owner
Home Financials are based on the most recent Mortgage that was taken out on this home.
Original Mortgage
$407,977
Outstanding Balance
$267,848
Interest Rate
4.25%
Mortgage Type
FHA
Estimated Equity
$600,955
Purchase Details
Closed on
Jul 3, 2008
Sold by
Sacks Sandra C
Bought by
The Sandra C Sacks Living Trust
Create a Home Valuation Report for This Property
The Home Valuation Report is an in-depth analysis detailing your home's value as well as a comparison with similar homes in the area
Home Values in the Area
Average Home Value in this Area
Purchase History
| Date | Buyer | Sale Price | Title Company |
|---|---|---|---|
| Greenberg Bradley | $420,000 | Title Agency Inc | |
| The Sandra C Sacks Living Trust | -- | None Available |
Source: Public Records
Mortgage History
| Date | Status | Borrower | Loan Amount |
|---|---|---|---|
| Open | Greenberg Bradley | $407,977 |
Source: Public Records
Tax History Compared to Growth
Tax History
| Year | Tax Paid | Tax Assessment Tax Assessment Total Assessment is a certain percentage of the fair market value that is determined by local assessors to be the total taxable value of land and additions on the property. | Land | Improvement |
|---|---|---|---|---|
| 2025 | $10,510 | $421,400 | $192,600 | $228,800 |
| 2024 | $10,046 | $421,400 | $192,600 | $228,800 |
| 2023 | $10,046 | $421,400 | $192,600 | $228,800 |
| 2022 | $9,185 | $395,400 | $192,600 | $202,800 |
| 2021 | $9,094 | $395,400 | $192,600 | $202,800 |
| 2020 | $9,090 | $395,400 | $192,600 | $202,800 |
| 2019 | $9,094 | $395,400 | $192,600 | $202,800 |
| 2018 | $8,940 | $395,400 | $192,600 | $202,800 |
| 2017 | $8,766 | $395,400 | $192,600 | $202,800 |
| 2016 | $8,730 | $395,400 | $192,600 | $202,800 |
| 2015 | $8,485 | $390,100 | $192,600 | $197,500 |
| 2014 | $8,086 | $367,900 | $192,600 | $175,300 |
Source: Public Records
Map
Nearby Homes
- 9 Bennett Ct
- 34 Brookside Cir
- 126 Wyncrest Rd
- 308 Pilot St
- 102 Pilot St
- 11 Woodview Dr
- 4 Terrace Dr
- 5 Homestead Cir
- 23 Eli Cir
- 54 Tracy Dr
- 37 Willow Grove Way
- 69 Caldwell Terrace
- 11 Liberty Rd
- 39 Homestead Cir
- 11 Churchill Ct
- 25 Highland Dr
- 57 Coventry Terrace
- 40 Caldwell Terrace
- 21 Wickatunk Rd
- 41 Longstreet Rd