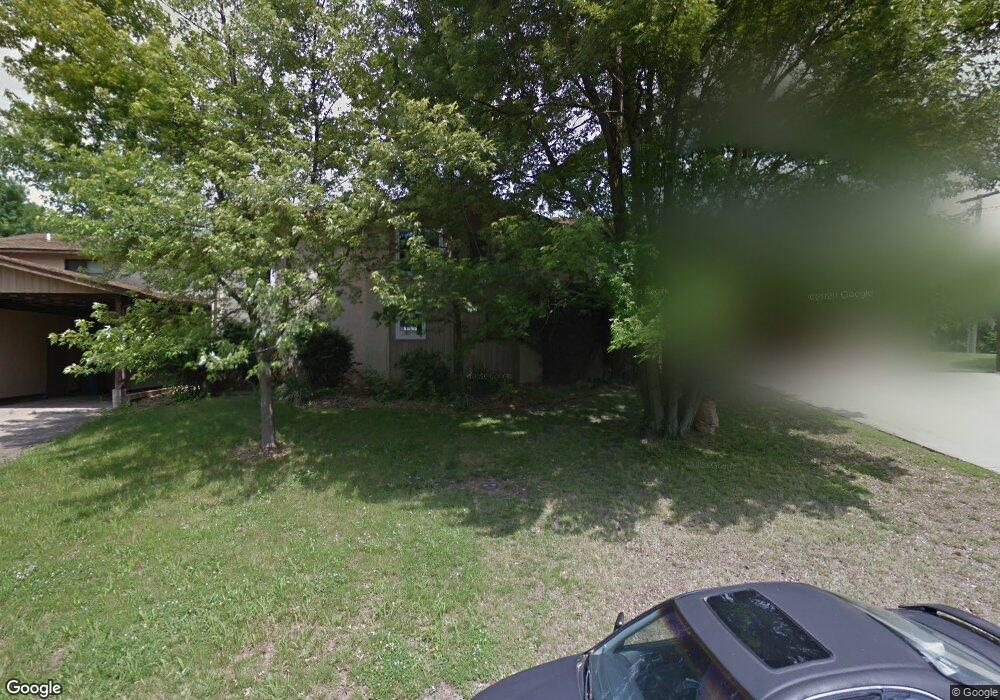
5 Twin Oaks Dr Belleville, IL 62221
Estimated Value: $187,000 - $209,082
2
Beds
3
Baths
1,400
Sq Ft
$143/Sq Ft
Est. Value
About This Home
This home is located at 5 Twin Oaks Dr, Belleville, IL 62221 and is currently estimated at $200,521, approximately $143 per square foot. 5 Twin Oaks Dr is a home located in St. Clair County with nearby schools including Shiloh Elementary School, Shiloh Middle School, and O'Fallon Township High School.
Ownership History
Date
Name
Owned For
Owner Type
Purchase Details
Closed on
Mar 1, 2015
Sold by
Brunner Cari Elizabeth and Brunner Philip Joel
Bought by
Brunner Properties Llc
Current Estimated Value
Purchase Details
Closed on
Feb 10, 2015
Sold by
Wells Fargo Bank Na
Bought by
Brunner Cari Elizabeth and Brunner Philip Joel
Purchase Details
Closed on
Jan 6, 2015
Sold by
Giusti Mary Kathryn and Woods Mary K
Bought by
Wells Fargo Bank Na
Purchase Details
Closed on
Jul 16, 2012
Sold by
Federal Home Loan Mortgage Corporation
Bought by
Giusti Mary Kathryn
Home Financials for this Owner
Home Financials are based on the most recent Mortgage that was taken out on this home.
Original Mortgage
$48,995
Interest Rate
3.48%
Mortgage Type
FHA
Purchase Details
Closed on
Aug 15, 2005
Sold by
Lester James M and Martell James F
Bought by
Zamarron Margaret R
Create a Home Valuation Report for This Property
The Home Valuation Report is an in-depth analysis detailing your home's value as well as a comparison with similar homes in the area
Home Values in the Area
Average Home Value in this Area
Purchase History
| Date | Buyer | Sale Price | Title Company |
|---|---|---|---|
| Brunner Properties Llc | -- | Town & Country Title Co | |
| Brunner Cari Elizabeth | $41,000 | Town&Country Title Co | |
| Wells Fargo Bank Na | -- | None Available | |
| Giusti Mary Kathryn | $50,000 | Atg | |
| Zamarron Margaret R | -- | -- |
Source: Public Records
Mortgage History
| Date | Status | Borrower | Loan Amount |
|---|---|---|---|
| Previous Owner | Giusti Mary Kathryn | $48,995 |
Source: Public Records
Tax History Compared to Growth
Tax History
| Year | Tax Paid | Tax Assessment Tax Assessment Total Assessment is a certain percentage of the fair market value that is determined by local assessors to be the total taxable value of land and additions on the property. | Land | Improvement |
|---|---|---|---|---|
| 2024 | $3,845 | $51,867 | $6,213 | $45,654 |
| 2023 | $3,197 | $42,146 | $6,030 | $36,116 |
| 2022 | $3,070 | $39,257 | $5,617 | $33,640 |
| 2021 | $2,868 | $36,916 | $5,282 | $31,634 |
| 2020 | $2,960 | $34,841 | $4,985 | $29,856 |
| 2019 | $2,446 | $29,306 | $5,178 | $24,128 |
| 2018 | $2,403 | $28,469 | $5,030 | $23,439 |
| 2017 | $2,436 | $28,331 | $4,794 | $23,537 |
| 2016 | $2,418 | $27,792 | $4,703 | $23,089 |
| 2014 | $2,633 | $32,817 | $3,972 | $28,845 |
| 2013 | -- | $33,260 | $4,026 | $29,234 |
Source: Public Records
Map
Nearby Homes
- 101 Montrose Ct
- 409 Sage Dr
- 3830 Breezy Hill
- 3567 Sky Hawk Dr
- 3716 Osprey Ct
- 3533 Capri Ln
- 3700 Osprey Ct
- 3719 Thicket Dr
- 433 Briarberry Dr
- 3714 Thicket Dr
- 414 Grand Reserve
- 3536 Harbor Way
- 3745 Thicket Dr
- 505 Master Ct
- 3740 Golfview Cir
- xxxx Christine Dr
- xxxx Chippewa Dr
- 31 Ramona Dr
- Brady Plan at Indian Springs - Indian Spring
- Winchester B Plan at Indian Springs - Indian Spring