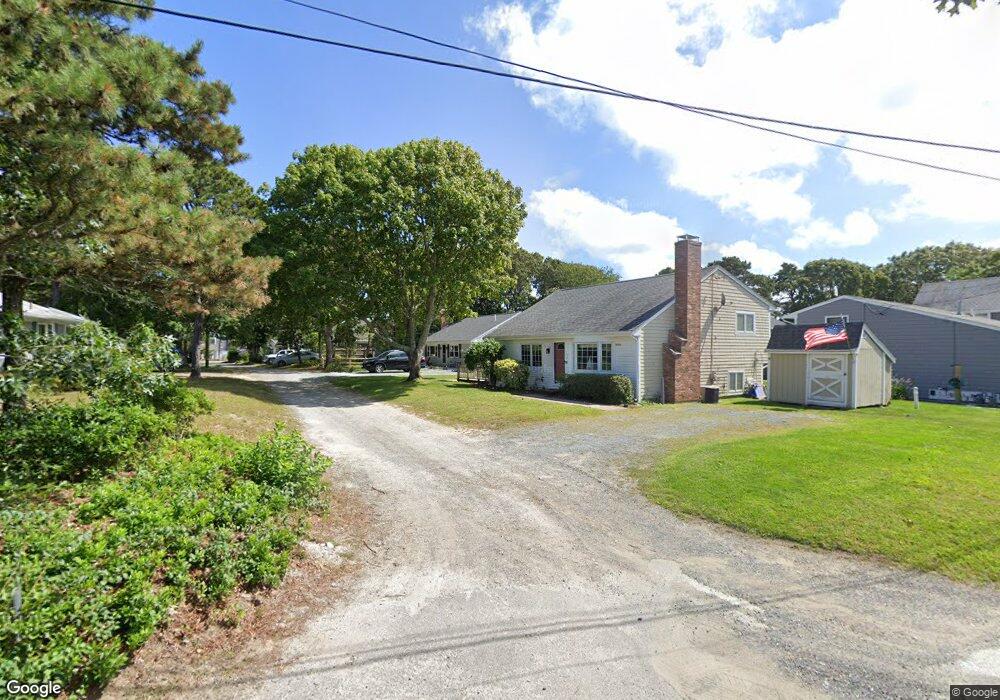
5 Union Park Rd Dennis Port, MA 02639
Dennis Port NeighborhoodEstimated Value: $593,000 - $849,000
3
Beds
2
Baths
1,496
Sq Ft
$522/Sq Ft
Est. Value
About This Home
This home is located at 5 Union Park Rd, Dennis Port, MA 02639 and is currently estimated at $780,477, approximately $521 per square foot. 5 Union Park Rd is a home located in Barnstable County with nearby schools including Dennis-Yarmouth Regional High School and St. Pius X. School.
Ownership History
Date
Name
Owned For
Owner Type
Purchase Details
Closed on
Mar 3, 2022
Sold by
Martiniello Anthony and Martiniello Wendy
Bought by
Martiniello Anthony and Martiniello Wendy
Current Estimated Value
Purchase Details
Closed on
Mar 12, 2007
Sold by
Goldman Susan E
Bought by
Goldman Harvey
Purchase Details
Closed on
Jun 20, 2001
Sold by
Steele Paul A and Steels Jeanne M
Bought by
Goldman Harvey and Goldman Susan E
Home Financials for this Owner
Home Financials are based on the most recent Mortgage that was taken out on this home.
Original Mortgage
$204,400
Interest Rate
7.09%
Mortgage Type
Purchase Money Mortgage
Purchase Details
Closed on
Apr 4, 1997
Sold by
Shear Rt
Bought by
Steele Paul A and Steele Jeanne M
Home Financials for this Owner
Home Financials are based on the most recent Mortgage that was taken out on this home.
Original Mortgage
$140,000
Interest Rate
7.5%
Mortgage Type
Purchase Money Mortgage
Create a Home Valuation Report for This Property
The Home Valuation Report is an in-depth analysis detailing your home's value as well as a comparison with similar homes in the area
Home Values in the Area
Average Home Value in this Area
Purchase History
| Date | Buyer | Sale Price | Title Company |
|---|---|---|---|
| Martiniello Anthony | -- | None Available | |
| Goldman Harvey | -- | -- | |
| Goldman Harvey | $292,000 | -- | |
| Steele Paul A | $155,750 | -- |
Source: Public Records
Mortgage History
| Date | Status | Borrower | Loan Amount |
|---|---|---|---|
| Previous Owner | Steele Paul A | $256,000 | |
| Previous Owner | Steele Paul A | $204,400 | |
| Previous Owner | Steele Paul A | $100,000 | |
| Previous Owner | Steele Paul A | $140,000 |
Source: Public Records
Tax History Compared to Growth
Tax History
| Year | Tax Paid | Tax Assessment Tax Assessment Total Assessment is a certain percentage of the fair market value that is determined by local assessors to be the total taxable value of land and additions on the property. | Land | Improvement |
|---|---|---|---|---|
| 2025 | $2,984 | $689,200 | $276,500 | $412,700 |
| 2024 | $2,878 | $655,500 | $265,900 | $389,600 |
| 2023 | $2,783 | $596,000 | $241,700 | $354,300 |
| 2022 | $2,528 | $451,500 | $190,500 | $261,000 |
| 2021 | $2,566 | $425,600 | $186,800 | $238,800 |
| 2020 | $2,180 | $357,300 | $186,800 | $170,500 |
| 2019 | $2,361 | $382,600 | $198,800 | $183,800 |
| 2018 | $2,300 | $362,700 | $189,300 | $173,400 |
| 2017 | $4,018 | $342,200 | $174,300 | $167,900 |
| 2016 | $2,001 | $306,400 | $164,400 | $142,000 |
| 2015 | $1,961 | $306,400 | $164,400 | $142,000 |
| 2014 | $1,882 | $296,400 | $154,400 | $142,000 |
Source: Public Records
Map
Nearby Homes
- 102 Sea St
- 402 Old Wharf Rd
- 402 Old Wharf Rd
- 405 Old Wharf Rd Unit B204
- 405 Old Wharf Rd Unit B204
- 22 Ferncliff Rd
- 37-A Beach Hills Rd
- 37 Beach Hills Rd
- 9 Chase Ave Unit 6
- 11 Ocean Park W
- 262 Old Wharf Rd Unit 67
- 262 Old Wharf Rd Unit 5
- 262 Old Wharf Rd Unit 5
- 262 Old Wharf Rd Unit 20
- 262 Old Wharf Rd Unit 87
- 241 Old Wharf Rd Unit 82
- 241 Old Wharf Rd Unit 127
- 241 Old Wharf Rd Unit 90
- 26 Manning Rd
- 12 Cross St
- 7 Union Park Rd
- 3 Union Park Rd
- 8 Pilgrim Terrace
- 6 Pilgrim Terrace
- 42 Union Wharf Rd
- 9 Union Park Rd
- 4 Union Park Rd
- 10 Union Park Rd
- 40 Union Wharf Rd
- 0 Union Wharf Rd Unit 1,2
- 368 Old Wharf Rd
- 374 Old Wharf Rd
- 370 Old Wharf Rd
- 52 Union Wharf Rd
- 11 Union Park Rd
- 7 Pilgrim Terrace
- 5 Pilgrim Terrace
- 12 Union Park Rd
- 47 Union Wharf Rd
- 43 Union Wharf Rd