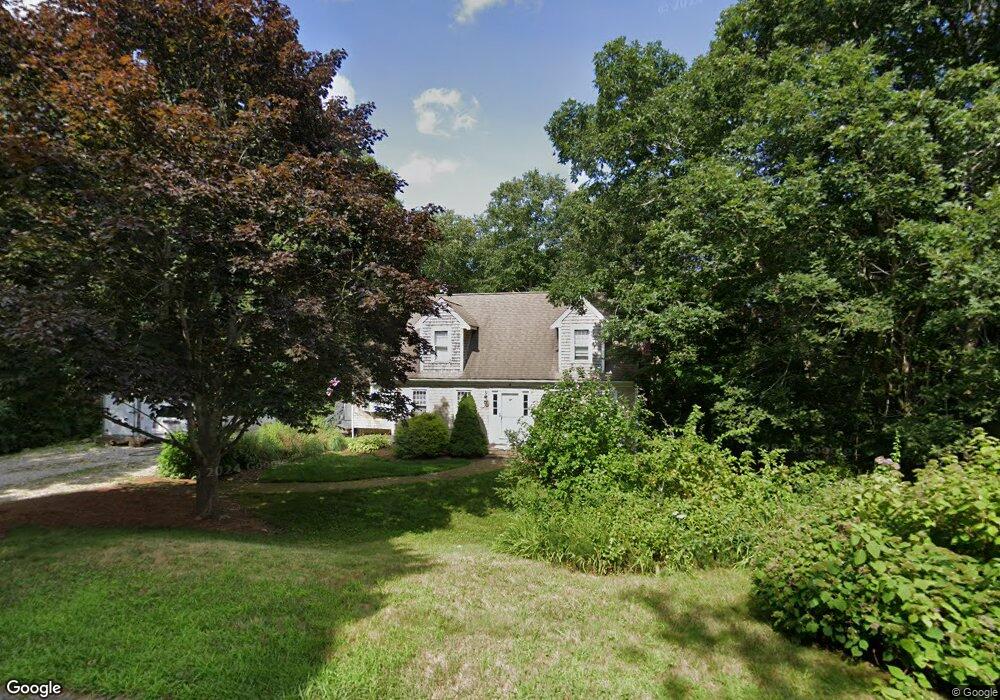
5 Up Hill Rd Forestdale, MA 02644
Forestdale NeighborhoodEstimated Value: $624,000 - $732,000
4
Beds
2
Baths
1,720
Sq Ft
$397/Sq Ft
Est. Value
About This Home
This home is located at 5 Up Hill Rd, Forestdale, MA 02644 and is currently estimated at $682,154, approximately $396 per square foot. 5 Up Hill Rd is a home located in Barnstable County with nearby schools including Sandwich Middle High School and Montessori School of Sandwich.
Ownership History
Date
Name
Owned For
Owner Type
Purchase Details
Closed on
Dec 7, 2004
Sold by
Sanford Lee E and Sage Sanford Wanda
Bought by
Clifford Corey and Clifford Patricia
Current Estimated Value
Home Financials for this Owner
Home Financials are based on the most recent Mortgage that was taken out on this home.
Original Mortgage
$314,900
Outstanding Balance
$157,282
Interest Rate
5.69%
Mortgage Type
Purchase Money Mortgage
Estimated Equity
$524,872
Create a Home Valuation Report for This Property
The Home Valuation Report is an in-depth analysis detailing your home's value as well as a comparison with similar homes in the area
Home Values in the Area
Average Home Value in this Area
Purchase History
| Date | Buyer | Sale Price | Title Company |
|---|---|---|---|
| Clifford Corey | $349,900 | -- |
Source: Public Records
Mortgage History
| Date | Status | Borrower | Loan Amount |
|---|---|---|---|
| Open | Clifford Corey | $314,900 | |
| Closed | Clifford Corey | $259,000 |
Source: Public Records
Tax History Compared to Growth
Tax History
| Year | Tax Paid | Tax Assessment Tax Assessment Total Assessment is a certain percentage of the fair market value that is determined by local assessors to be the total taxable value of land and additions on the property. | Land | Improvement |
|---|---|---|---|---|
| 2025 | $6,158 | $582,600 | $154,800 | $427,800 |
| 2024 | $5,855 | $542,100 | $138,300 | $403,800 |
| 2023 | $5,725 | $497,800 | $125,700 | $372,100 |
| 2022 | $5,463 | $415,100 | $114,700 | $300,400 |
| 2021 | $5,193 | $377,100 | $109,700 | $267,400 |
| 2020 | $5,222 | $364,900 | $111,300 | $253,600 |
| 2019 | $4,946 | $345,400 | $106,300 | $239,100 |
| 2018 | $4,684 | $327,800 | $105,500 | $222,300 |
| 2017 | $4,630 | $310,100 | $102,100 | $208,000 |
| 2016 | $4,363 | $301,500 | $98,900 | $202,600 |
| 2015 | $4,369 | $294,800 | $95,800 | $199,000 |
Source: Public Records
Map
Nearby Homes