Y
Seller's Agent in 2025
Yuri Beato
RE/MAX
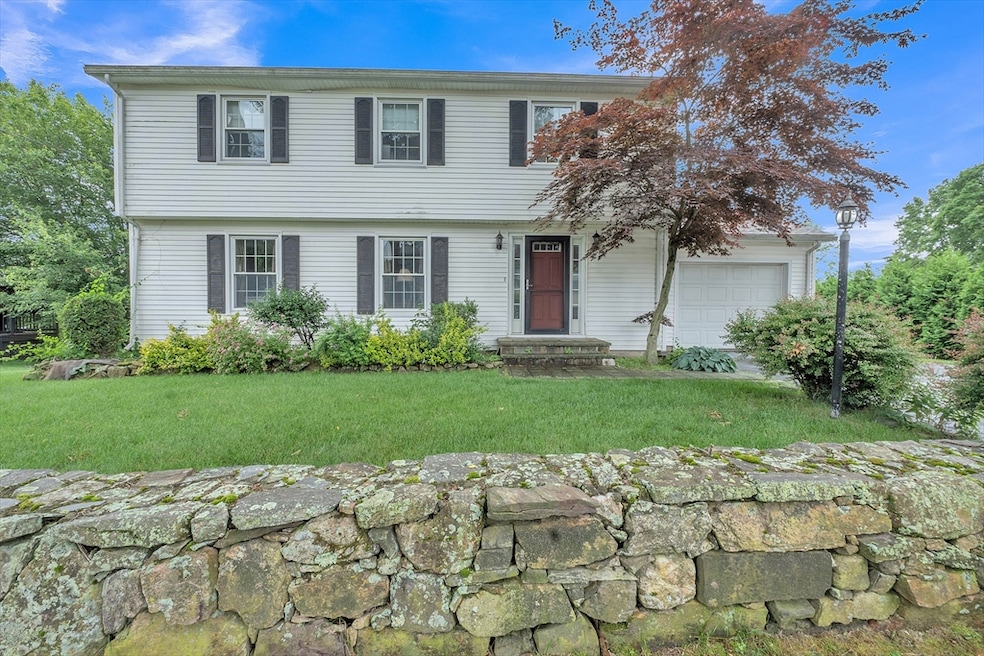
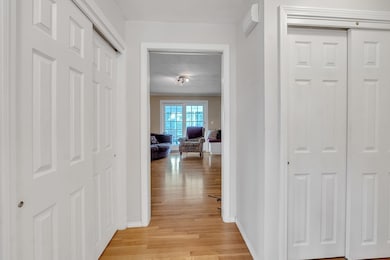
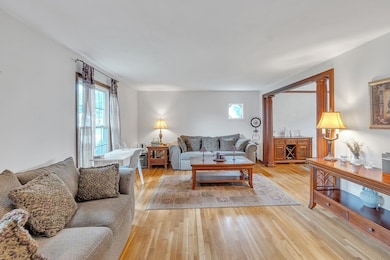
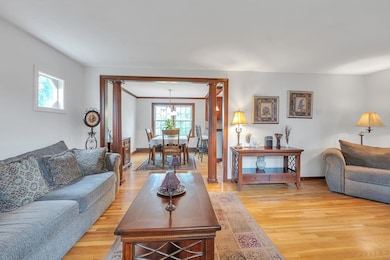

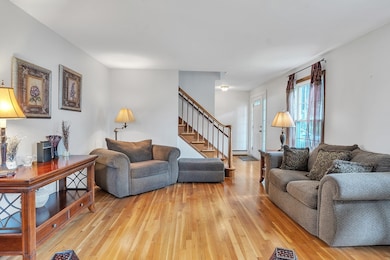
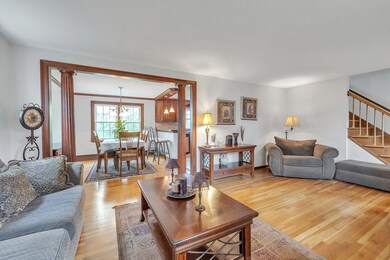
Fall in love with the charm and comfort of 5 Upland Street in Auburn! This beautifully maintained 4-bedroom, 1.5-bath home offers warm hardwood floors throughout the main living areas and a spacious, updated kitchen perfect for creating home-cooked memories. The sun-filled family room boasts a custom built-in corner bookcase and opens to a serene enclosed deck—ideal for relaxing, entertaining, or enjoying your morning coffee in peace. A walk-out basement, plenty of closet space, and a one-car garage add to the home’s everyday convenience. Outside, the lush yard provides the perfect backdrop for gatherings, play, or quiet afternoons. Nestled in a sought-after neighborhood, you’ll be just minutes from the scenic Pakachoag Golf Course and enjoy quick access to major highways, including I-290 and the Mass Pike, making commuting a breeze. This home is the perfect blend of charm, function, and location—don’t miss your chance to make it yours!
Last Agent to Sell the Property
Yuri Beato
RE/MAX Diverse Listed on: 06/20/2025

| Date | Type | Sale Price | Title Company |
|---|---|---|---|
| Quit Claim Deed | $540,000 | -- | |
| Deed | $540,000 | -- | |
| Quit Claim Deed | -- | None Available | |
| Quit Claim Deed | -- | None Available | |
| Deed | $285,000 | -- | |
| Deed | $285,000 | -- | |
| Deed | $285,000 | -- |
| Date | Status | Loan Amount | Loan Type |
|---|---|---|---|
| Open | $265,000 | New Conventional | |
| Closed | $265,000 | New Conventional | |
| Previous Owner | $116,000 | New Conventional | |
| Previous Owner | $170,000 | No Value Available | |
| Previous Owner | $38,000 | No Value Available |
| Date | Event | Price | List to Sale | Price per Sq Ft |
|---|---|---|---|---|
| 08/01/2025 08/01/25 | Sold | $540,000 | +1.9% | $283 / Sq Ft |
| 06/27/2025 06/27/25 | For Sale | $529,900 | 0.0% | $278 / Sq Ft |
| 06/21/2025 06/21/25 | Pending | -- | -- | -- |
| 06/20/2025 06/20/25 | For Sale | $529,900 | -- | $278 / Sq Ft |
| Year | Tax Paid | Tax Assessment Tax Assessment Total Assessment is a certain percentage of the fair market value that is determined by local assessors to be the total taxable value of land and additions on the property. | Land | Improvement |
|---|---|---|---|---|
| 2025 | $5,616 | $393,000 | $114,200 | $278,800 |
| 2024 | $6,087 | $407,700 | $108,500 | $299,200 |
| 2023 | $5,801 | $365,300 | $98,600 | $266,700 |
| 2022 | $5,357 | $318,500 | $98,600 | $219,900 |
| 2021 | $806 | $283,900 | $87,000 | $196,900 |
| 2020 | $7,397 | $283,900 | $87,000 | $196,900 |
| 2019 | $4,741 | $257,400 | $86,100 | $171,300 |
| 2018 | $4,769 | $258,600 | $80,500 | $178,100 |
| 2017 | $4,858 | $264,900 | $73,000 | $191,900 |
| 2016 | $4,787 | $264,600 | $76,800 | $187,800 |
| 2015 | $4,369 | $253,100 | $76,800 | $176,300 |
| 2014 | $4,255 | $246,100 | $73,100 | $173,000 |
Y
Seller's Agent in 2025
Yuri Beato
RE/MAX
Buyer's Agent in 2025
Andrew Bruce
Lamacchia Realty, Inc.
(617) 646-9613
1 in this area
220 Total Sales
Source: MLS Property Information Network (MLS PIN)
MLS Number: 73394300
APN: AUBU-000012-000000-000008
Disclaimer: Certain information contained herein is derived from information provided by parties other than Homes.com. All information provided is deemed reliable, but is not guaranteed to be accurate and should be independently verified.
![]() The property listing data and information, or the Images, set forth herein were provided to MLS Property Information Network, Inc. from third party sources, including sellers, lessors and public records, and were compiled by MLS Property Information Network, Inc. The property listing data and information, and the Images, are for the personal, non-commercial use of consumers having a good faith interest in purchasing or leasing listed properties of the type displayed to them and may not be used for any purpose other than to identify prospective properties which such consumers may have a good faith interest in purchasing or leasing. MLS Property Information Network, Inc. and its subscribers disclaim any and all representations and warranties as to the accuracy of the property listing data and information, or as to the accuracy of any of the Images, set forth herein.
The property listing data and information, or the Images, set forth herein were provided to MLS Property Information Network, Inc. from third party sources, including sellers, lessors and public records, and were compiled by MLS Property Information Network, Inc. The property listing data and information, and the Images, are for the personal, non-commercial use of consumers having a good faith interest in purchasing or leasing listed properties of the type displayed to them and may not be used for any purpose other than to identify prospective properties which such consumers may have a good faith interest in purchasing or leasing. MLS Property Information Network, Inc. and its subscribers disclaim any and all representations and warranties as to the accuracy of the property listing data and information, or as to the accuracy of any of the Images, set forth herein.
Ask me questions while you tour the home.