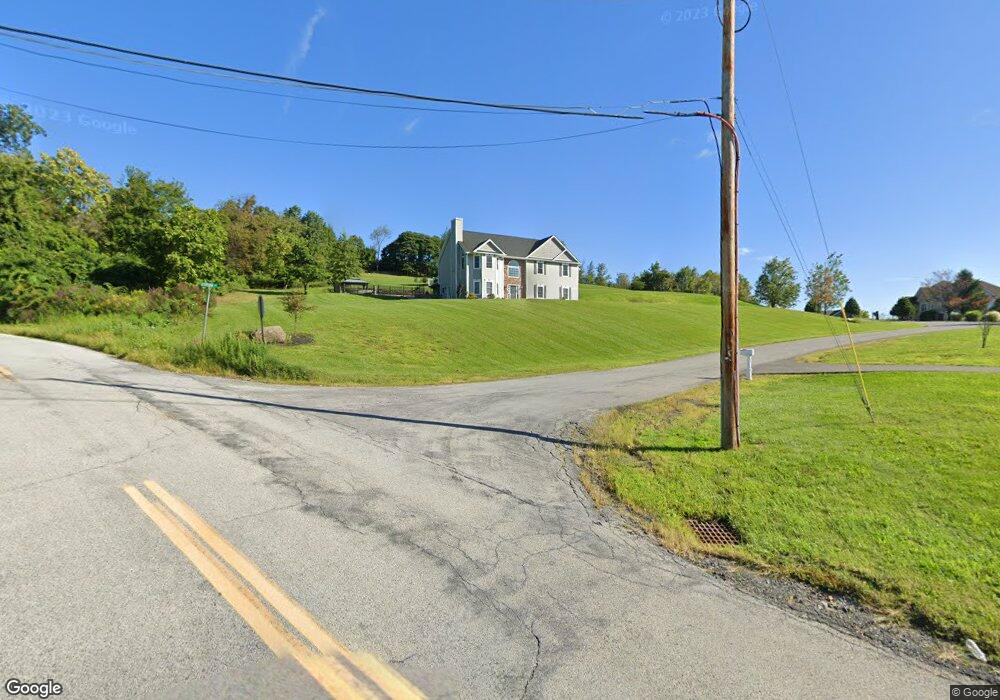
5 Utopian Ct Newburgh, NY 12550
Estimated Value: $630,065 - $797,000
4
Beds
4
Baths
4,000
Sq Ft
$179/Sq Ft
Est. Value
About This Home
This home is located at 5 Utopian Ct, Newburgh, NY 12550 and is currently estimated at $717,516, approximately $179 per square foot. 5 Utopian Ct is a home located in Orange County with nearby schools including Marlboro Central High School.
Ownership History
Date
Name
Owned For
Owner Type
Purchase Details
Closed on
Aug 21, 2017
Sold by
Aponte Chandra
Bought by
Lefkowski Anthony
Current Estimated Value
Home Financials for this Owner
Home Financials are based on the most recent Mortgage that was taken out on this home.
Original Mortgage
$267,200
Outstanding Balance
$222,958
Interest Rate
3.96%
Mortgage Type
Purchase Money Mortgage
Estimated Equity
$494,558
Purchase Details
Closed on
Nov 25, 2015
Sold by
Cotter Road Llc
Bought by
Aponte Chandra
Home Financials for this Owner
Home Financials are based on the most recent Mortgage that was taken out on this home.
Original Mortgage
$332,074
Interest Rate
4.25%
Mortgage Type
FHA
Purchase Details
Closed on
Jun 18, 2015
Sold by
Lipiro Jason
Bought by
Cotter Road Llc
Purchase Details
Closed on
Apr 9, 2008
Sold by
Double R Equities Llc
Bought by
Lipiro Jason
Purchase Details
Closed on
Mar 22, 2002
Sold by
Double R Equities Llc
Bought by
Hillside Homes & Development Corp
Create a Home Valuation Report for This Property
The Home Valuation Report is an in-depth analysis detailing your home's value as well as a comparison with similar homes in the area
Home Values in the Area
Average Home Value in this Area
Purchase History
| Date | Buyer | Sale Price | Title Company |
|---|---|---|---|
| Lefkowski Anthony | $340,000 | Richard Strassfield | |
| Aponte Chandra | $338,200 | Gary Sobo | |
| Cotter Road Llc | $62,000 | Mark Aberasturi | |
| Lipiro Jason | $80,000 | Richard Forbes | |
| Hillside Homes & Development Corp | $75,000 | -- |
Source: Public Records
Mortgage History
| Date | Status | Borrower | Loan Amount |
|---|---|---|---|
| Open | Lefkowski Anthony | $267,200 | |
| Previous Owner | Aponte Chandra | $332,074 |
Source: Public Records
Tax History
| Year | Tax Paid | Tax Assessment Tax Assessment Total Assessment is a certain percentage of the fair market value that is determined by local assessors to be the total taxable value of land and additions on the property. | Land | Improvement |
|---|---|---|---|---|
| 2024 | $12,541 | $113,650 | $12,700 | $100,950 |
| 2023 | $12,541 | $113,650 | $12,700 | $100,950 |
| 2022 | $12,988 | $113,650 | $12,700 | $100,950 |
| 2021 | $14,044 | $113,650 | $12,700 | $100,950 |
| 2020 | $13,930 | $113,650 | $12,700 | $100,950 |
| 2019 | $13,131 | $113,650 | $12,700 | $100,950 |
| 2018 | $13,131 | $113,650 | $12,700 | $100,950 |
| 2017 | $12,657 | $113,650 | $12,700 | $100,950 |
| 2016 | $13,842 | $127,300 | $12,700 | $114,600 |
| 2015 | -- | $12,700 | $12,700 | $0 |
| 2014 | -- | $12,700 | $12,700 | $0 |
Source: Public Records
Map
Nearby Homes
- 165 Lattintown Rd Unit Lot 60
- 237 Lattintown Rd
- 9 Domingues Rd
- 245-249 Lattintown Rd
- 6 Silvestri Place
- 12 Hampton Rd
- 98 Lattintown Rd
- 18 Russo Dr
- 1404 Parr Lake Dr Unit 14D
- 606 Parr Meadow Dr Unit 6F
- 304 Parr Meadow Dr Unit 3D
- 404 Parr Meadow Dr Unit 4D
- 503 Parr Meadow Dr Unit 5C
- 1605 Baldwin Ln Unit 16E
- 411 Plattekill Rd
- 1201 Mcintosh Place Unit 12a
- 223 Plattekill Rd
- 1 Far Horizons Dr
- 10 Diviesti Dr
- 102 Old Post Rd
- 5 Utopian Ct
- 0 Lot 1 Utopian Ct Unit 316206
- Lot #1 Utopian Ct
- 3 Utopian Ct
- 1 Utopian Ct
- 7 Utopian Ct
- 4 Utopian Ct
- 2 Utopian Ct
- 2 Utopian Ct
- 6 Utopian Ct
- 207 Candlestick Hill Rd
- 8 Utopian Ct
- 252 Candlestick Hill Rd
- 241 Candlestick Hill Rd
- 5 Madison Rose Ct
- 213 Candlestick Hill Rd
- 13 Madison Rose Ct
- 17 Madison Rose Ct
- 13 Madison Rose Ct
- 10 Madison Rose Ct
Your Personal Tour Guide
Ask me questions while you tour the home.