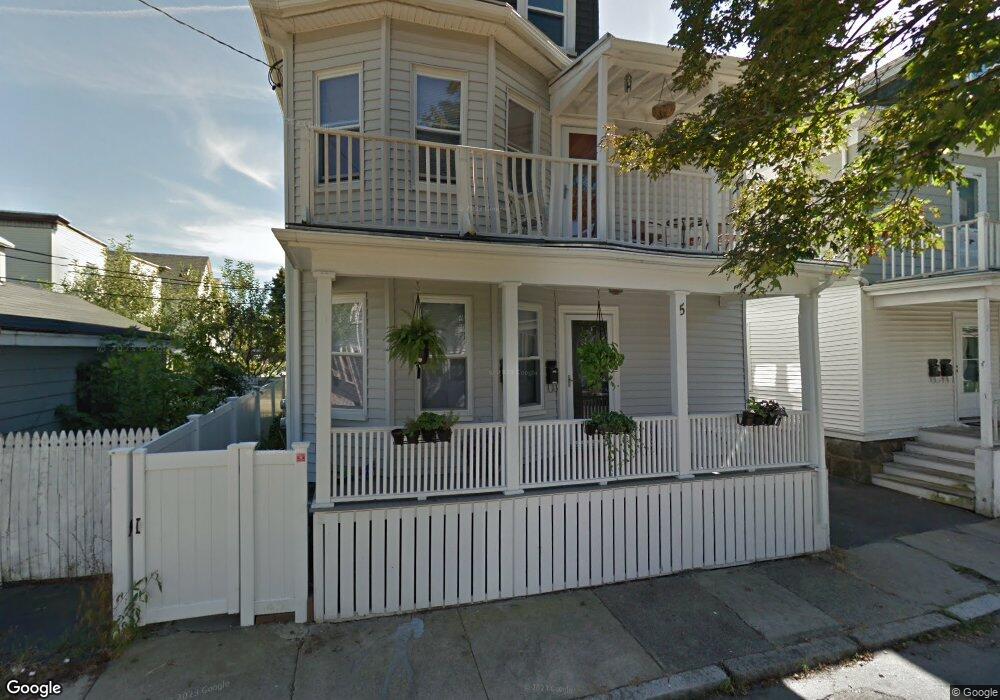
5 Vale St Salem, MA 01970
Downtown Salem NeighborhoodEstimated Value: $794,000 - $871,000
4
Beds
2
Baths
2,122
Sq Ft
$394/Sq Ft
Est. Value
About This Home
This home is located at 5 Vale St, Salem, MA 01970 and is currently estimated at $835,542, approximately $393 per square foot. 5 Vale St is a home located in Essex County with nearby schools including Horace Mann Laboratory, Saltonstall School, and Carlton Elementary School.
Ownership History
Date
Name
Owned For
Owner Type
Purchase Details
Closed on
Oct 14, 2019
Sold by
Johnson Adam S and Johnson Kerri A
Bought by
Andersen Tassie K and Magliola Dale
Current Estimated Value
Home Financials for this Owner
Home Financials are based on the most recent Mortgage that was taken out on this home.
Original Mortgage
$420,000
Outstanding Balance
$363,881
Interest Rate
3.4%
Mortgage Type
New Conventional
Estimated Equity
$471,661
Purchase Details
Closed on
Oct 28, 2011
Sold by
Johnson Adam S
Bought by
Johnson Adam S and Johnson Kerri A
Purchase Details
Closed on
Sep 13, 2007
Sold by
Coyle Jamie P and Coyle Melissa M
Bought by
Johnson Adam S
Home Financials for this Owner
Home Financials are based on the most recent Mortgage that was taken out on this home.
Original Mortgage
$20,000
Interest Rate
6.51%
Purchase Details
Closed on
May 29, 1998
Sold by
Tache Norman R and Tache Claire F
Bought by
Coyle Jamie P and Coyle Gary Melissa
Purchase Details
Closed on
May 26, 1987
Sold by
Chemelski Regina
Bought by
Tache Norman R
Create a Home Valuation Report for This Property
The Home Valuation Report is an in-depth analysis detailing your home's value as well as a comparison with similar homes in the area
Home Values in the Area
Average Home Value in this Area
Purchase History
| Date | Buyer | Sale Price | Title Company |
|---|---|---|---|
| Andersen Tassie K | $525,000 | -- | |
| Andersen Tassie K | $525,000 | -- | |
| Johnson Adam S | -- | -- | |
| Johnson Adam S | $409,000 | -- | |
| Coyle Jamie P | $148,000 | -- | |
| Tache Norman R | $66,000 | -- |
Source: Public Records
Mortgage History
| Date | Status | Borrower | Loan Amount |
|---|---|---|---|
| Open | Andersen Tassie K | $420,000 | |
| Closed | Andersen Tassie K | $420,000 | |
| Previous Owner | Tache Norman R | $20,000 | |
| Previous Owner | Tache Norman R | $388,500 |
Source: Public Records
Tax History
| Year | Tax Paid | Tax Assessment Tax Assessment Total Assessment is a certain percentage of the fair market value that is determined by local assessors to be the total taxable value of land and additions on the property. | Land | Improvement |
|---|---|---|---|---|
| 2025 | $7,777 | $685,800 | $195,500 | $490,300 |
| 2024 | $7,440 | $640,300 | $185,800 | $454,500 |
| 2023 | $7,132 | $570,100 | $171,500 | $398,600 |
| 2022 | $7,117 | $537,100 | $165,800 | $371,300 |
| 2021 | $6,751 | $489,200 | $154,400 | $334,800 |
| 2020 | $6,228 | $431,000 | $145,800 | $285,200 |
| 2019 | $6,135 | $406,300 | $138,400 | $267,900 |
| 2018 | $5,677 | $369,100 | $131,500 | $237,600 |
| 2017 | $5,288 | $333,400 | $110,900 | $222,500 |
| 2016 | $5,144 | $328,300 | $105,800 | $222,500 |
| 2015 | $4,990 | $304,100 | $97,200 | $206,900 |
Source: Public Records
Map
Nearby Homes
- 15 Phelps St Unit 1
- 22 Prescott St Unit 2
- 22 Prescott St Unit 1
- 38 Chestnut St
- 35 Flint St Unit 209
- 35 Flint St Unit 106
- 11 Summer St
- 289 Essex St Unit 211
- 7 Fairfield St
- 17 North St Unit 2
- 23 Proctor St
- 16 River St
- 185 Lafayette St Unit 3
- 86 Flint St
- 10 Hazel St Unit 2
- 3 Chase St
- 13 Roslyn St Unit 2
- 65 Washington St Unit 512
- 11 Church St Unit 203
- 11 Church St Unit 702