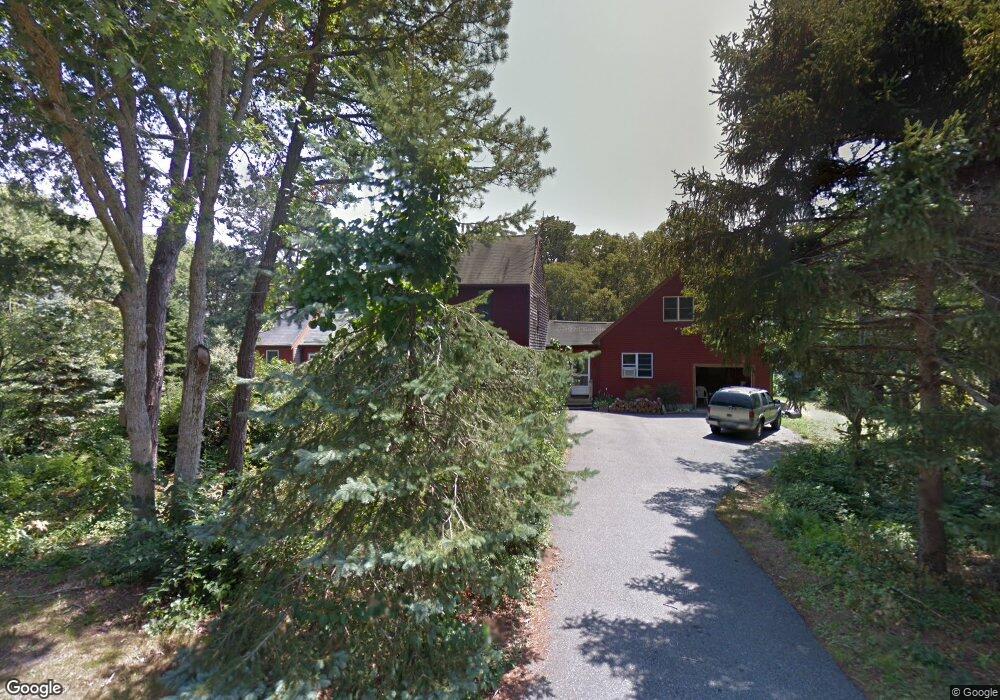
5 Walden Place Unit 1 Dennis, MA 02638
Dennis Village NeighborhoodEstimated Value: $916,000 - $1,357,000
4
Beds
3
Baths
2,694
Sq Ft
$396/Sq Ft
Est. Value
About This Home
This home is located at 5 Walden Place Unit 1, Dennis, MA 02638 and is currently estimated at $1,067,159, approximately $396 per square foot. 5 Walden Place Unit 1 is a home located in Barnstable County with nearby schools including Dennis-Yarmouth Regional High School.
Ownership History
Date
Name
Owned For
Owner Type
Purchase Details
Closed on
May 30, 2014
Sold by
Fisher Randall P and Fisher Elaine M
Bought by
Gammons Carl R and Gammons Donna L
Current Estimated Value
Home Financials for this Owner
Home Financials are based on the most recent Mortgage that was taken out on this home.
Original Mortgage
$308,000
Outstanding Balance
$234,799
Interest Rate
4.26%
Mortgage Type
New Conventional
Estimated Equity
$832,360
Create a Home Valuation Report for This Property
The Home Valuation Report is an in-depth analysis detailing your home's value as well as a comparison with similar homes in the area
Home Values in the Area
Average Home Value in this Area
Purchase History
| Date | Buyer | Sale Price | Title Company |
|---|---|---|---|
| Gammons Carl R | $385,000 | -- |
Source: Public Records
Mortgage History
| Date | Status | Borrower | Loan Amount |
|---|---|---|---|
| Open | Gammons Carl R | $308,000 |
Source: Public Records
Tax History
| Year | Tax Paid | Tax Assessment Tax Assessment Total Assessment is a certain percentage of the fair market value that is determined by local assessors to be the total taxable value of land and additions on the property. | Land | Improvement |
|---|---|---|---|---|
| 2025 | $3,564 | $823,000 | $190,700 | $632,300 |
| 2024 | $3,732 | $850,000 | $192,200 | $657,800 |
| 2023 | $3,613 | $773,600 | $174,700 | $598,900 |
| 2022 | $3,284 | $586,400 | $143,100 | $443,300 |
| 2021 | $3,070 | $509,100 | $140,200 | $368,900 |
| 2020 | $2,880 | $472,200 | $140,200 | $332,000 |
| 2019 | $2,934 | $475,500 | $151,300 | $324,200 |
| 2018 | $2,632 | $415,100 | $130,900 | $284,200 |
| 2017 | $2,553 | $415,100 | $130,900 | $284,200 |
| 2016 | $2,650 | $405,800 | $163,600 | $242,200 |
| 2015 | $2,655 | $414,800 | $163,600 | $251,200 |
| 2014 | $2,432 | $383,000 | $130,900 | $252,100 |
Source: Public Records
Map
Nearby Homes
- 26 S West Dr
- 59 Main St Unit 19-2
- 59 Route 6a Unit 29-4
- 268 Main St
- 568 Route 6a
- 59 Massachusetts 6a Unit 19-2
- 20 Bray Farm Rd S
- 6 Thomas Ct
- 480 Main St
- 15 Signal Hill Dr
- 35 Crown Grant Dr
- 15 Musket Ln
- 54 Kates Path Unit 54
- 16 Hazelwood Rd
- 930 Old Bass River Rd
- 15 John Hall Cartway Unit 15
- 645 Main St Back Lot
- 9 Split Rock Rd
- 228 Kates Path
- 10 Uncle Bills Way
Your Personal Tour Guide
Ask me questions while you tour the home.