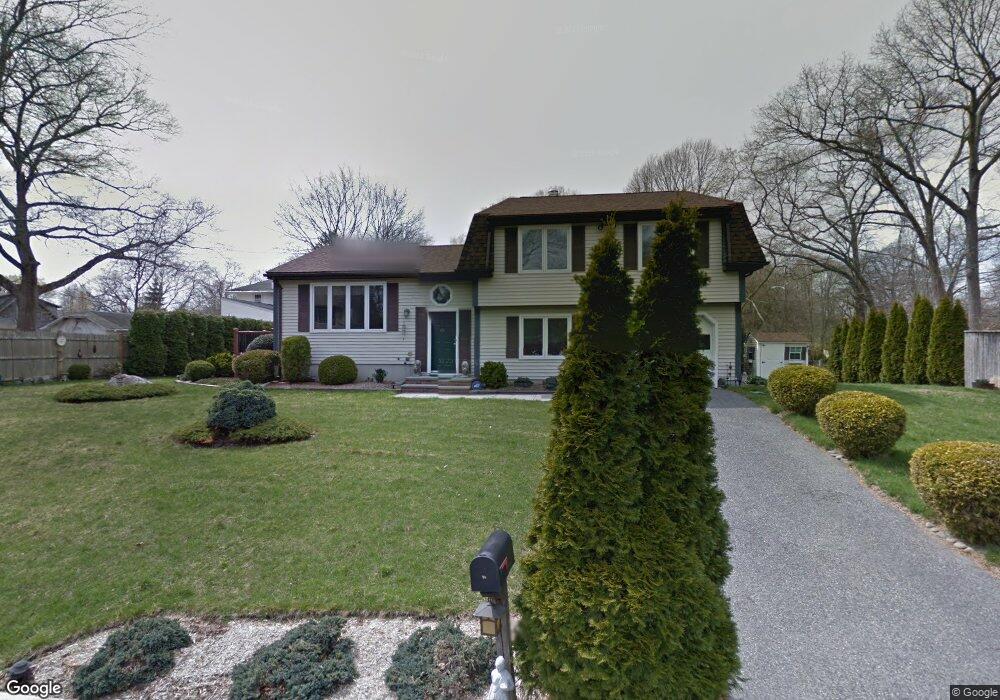
5 Walnut Rd Barrington, RI 02806
North Barrington NeighborhoodEstimated Value: $540,656 - $660,000
3
Beds
2
Baths
1,452
Sq Ft
$412/Sq Ft
Est. Value
About This Home
This home is located at 5 Walnut Rd, Barrington, RI 02806 and is currently estimated at $597,664, approximately $411 per square foot. 5 Walnut Rd is a home located in Bristol County with nearby schools including Barrington High School, St Luke Elementary School, and Barrington Christian Academy.
Ownership History
Date
Name
Owned For
Owner Type
Purchase Details
Closed on
Jul 7, 2023
Sold by
Radin Peter and Packer Susan E
Bought by
Radin Packer Ft and Radin
Current Estimated Value
Purchase Details
Closed on
Feb 27, 1998
Sold by
Cady Paul A
Bought by
Radin Peter and Packer Susan E
Purchase Details
Closed on
May 14, 1993
Sold by
Duncan Lester E and Neil Dawn M
Bought by
Cady Paul A
Home Financials for this Owner
Home Financials are based on the most recent Mortgage that was taken out on this home.
Original Mortgage
$127,800
Interest Rate
7.47%
Purchase Details
Closed on
Dec 3, 1990
Sold by
Gianlorenzo Henry R
Bought by
Duncan Lester E
Home Financials for this Owner
Home Financials are based on the most recent Mortgage that was taken out on this home.
Original Mortgage
$80,000
Interest Rate
10.16%
Create a Home Valuation Report for This Property
The Home Valuation Report is an in-depth analysis detailing your home's value as well as a comparison with similar homes in the area
Home Values in the Area
Average Home Value in this Area
Purchase History
| Date | Buyer | Sale Price | Title Company |
|---|---|---|---|
| Radin Packer Ft | -- | None Available | |
| Radin Peter | $156,000 | -- | |
| Cady Paul A | $142,000 | -- | |
| Cady Paul A | $142,000 | -- | |
| Duncan Lester E | $148,000 | -- | |
| Duncan Lester E | $148,000 | -- |
Source: Public Records
Mortgage History
| Date | Status | Borrower | Loan Amount |
|---|---|---|---|
| Previous Owner | Duncan Lester E | $114,000 | |
| Previous Owner | Duncan Lester E | $127,800 | |
| Previous Owner | Duncan Lester E | $80,000 |
Source: Public Records
Tax History
| Year | Tax Paid | Tax Assessment Tax Assessment Total Assessment is a certain percentage of the fair market value that is determined by local assessors to be the total taxable value of land and additions on the property. | Land | Improvement |
|---|---|---|---|---|
| 2025 | $6,857 | $447,000 | $229,000 | $218,000 |
| 2024 | $6,593 | $447,000 | $229,000 | $218,000 |
| 2023 | $6,212 | $306,000 | $134,000 | $172,000 |
| 2022 | $6,013 | $306,000 | $134,000 | $172,000 |
| 2021 | $5,860 | $306,000 | $134,000 | $172,000 |
| 2020 | $5,622 | $269,000 | $113,000 | $156,000 |
| 2019 | $5,407 | $269,000 | $113,000 | $156,000 |
| 2018 | $5,246 | $269,000 | $113,000 | $156,000 |
| 2017 | $5,390 | $269,500 | $112,300 | $157,200 |
| 2016 | $4,972 | $269,500 | $112,300 | $157,200 |
| 2015 | $4,918 | $269,500 | $112,300 | $157,200 |
| 2014 | $4,978 | $272,000 | $114,600 | $157,400 |
Source: Public Records
Map
Nearby Homes
- 168 Washington Rd
- 20 Townsend St
- 45 Washington Rd
- 11 Elton Rd
- 71 Alfred Drown Rd
- 154 Lincoln Ave
- 85 Hilton Ave
- 236 Becker Ave
- 29 N Lake Dr
- 6 Conway Dr
- 150 Alfred Drowne Rd
- 603 Maple Ave
- 6 Hazelton Rd
- 0 Carousel Dr
- 53 Whipple Ave
- 26 Tiffany Cir
- 9 Mystic Ave
- 14 Winthrop St
- 916 Bullocks Pt Ave
- 22 Grassy Plain Rd
Your Personal Tour Guide
Ask me questions while you tour the home.