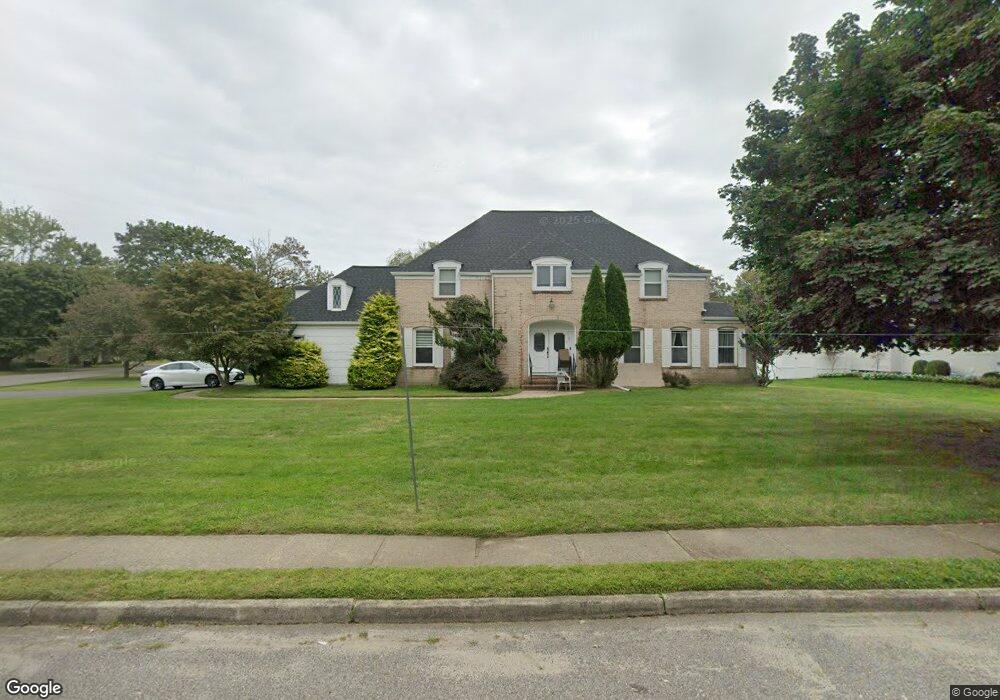
5 Wenning Ct Oakhurst, NJ 07755
Estimated Value: $1,914,261 - $2,912,000
About This Home
This home is located at 5 Wenning Ct, Oakhurst, NJ 07755 and is currently estimated at $2,306,315, approximately $671 per square foot. 5 Wenning Ct is a home located in Monmouth County with nearby schools including Ocean Township High School, St. Mary of the Assumption School, and Bnot Shirah of Deal.
Ownership History
We collect this data history from publicly available records. To have your information removed, we recommend requesting removal directly through your county’s website.
Purchase Details
Home Financials for this Owner
Home Financials are based on the most recent Mortgage that was taken out on this home.Home Values in the Area
Average Home Value in this Area
Purchase History
We collect this data history from publicly available records. To have your information removed, we recommend requesting removal directly through your county’s website.
| Date | Buyer | Sale Price | Title Company |
|---|---|---|---|
| -- | Summit Title | ||
| -- | Summit Title |
Mortgage History
We collect this data history from publicly available records. To have your information removed, we recommend requesting removal directly through your county’s website.
| Date | Status | Borrower | Loan Amount |
|---|---|---|---|
| Open | $3,420,000 | ||
| Closed | $3,420,000 |
Tax History
We collect this data history from publicly available records. To have your information removed, we recommend requesting removal directly through your county’s website.
| Year | Tax Paid | Tax Assessment Tax Assessment Total Assessment is a certain percentage of the fair market value that is determined by local assessors to be the total taxable value of land and additions on the property. | Land | Improvement |
|---|---|---|---|---|
| 2025 | $15,582 | $1,422,600 | $867,400 | $555,200 |
| 2024 | $16,492 | $1,092,700 | $586,300 | $506,400 |
| 2023 | $16,492 | $1,078,600 | $586,300 | $492,300 |
| 2022 | $18,231 | $1,055,000 | $586,300 | $468,700 |
| 2021 | $18,231 | $927,800 | $546,300 | $381,500 |
| 2020 | $17,304 | $869,100 | $496,300 | $372,800 |
| 2019 | $17,309 | $848,900 | $496,300 | $352,600 |
| 2018 | $17,433 | $832,500 | $496,300 | $336,200 |
| 2017 | $17,121 | $814,100 | $496,300 | $317,800 |
| 2016 | $16,371 | $700,200 | $497,200 | $203,000 |
| 2015 | $17,140 | $742,300 | $527,200 | $215,100 |
| 2014 | $17,131 | $752,000 | $527,200 | $224,800 |
Map
- 4 Mount Ct
- 460 Runyan Ave
- 1 Country Club Dr
- 35 Shadow Lawn Dr
- 9 Dwight Dr
- 232 Woodcrest Rd
- 235 Cliftwood Rd
- 450 Wells Ave
- 420 Wells Ave
- 197 Delaware Ave
- 317 Roosevelt Ave
- 409 Wells Ave
- 189 Monmouth Rd
- 176 Belmar Ave
- 514 Deal Rd
- 0 Overbrook Ave
- 405 Lawrence Ave
- 6 Surrey Ln
- 267 Roosevelt Ave
- 144 Monmouth Rd
Ask me questions while you tour the home.