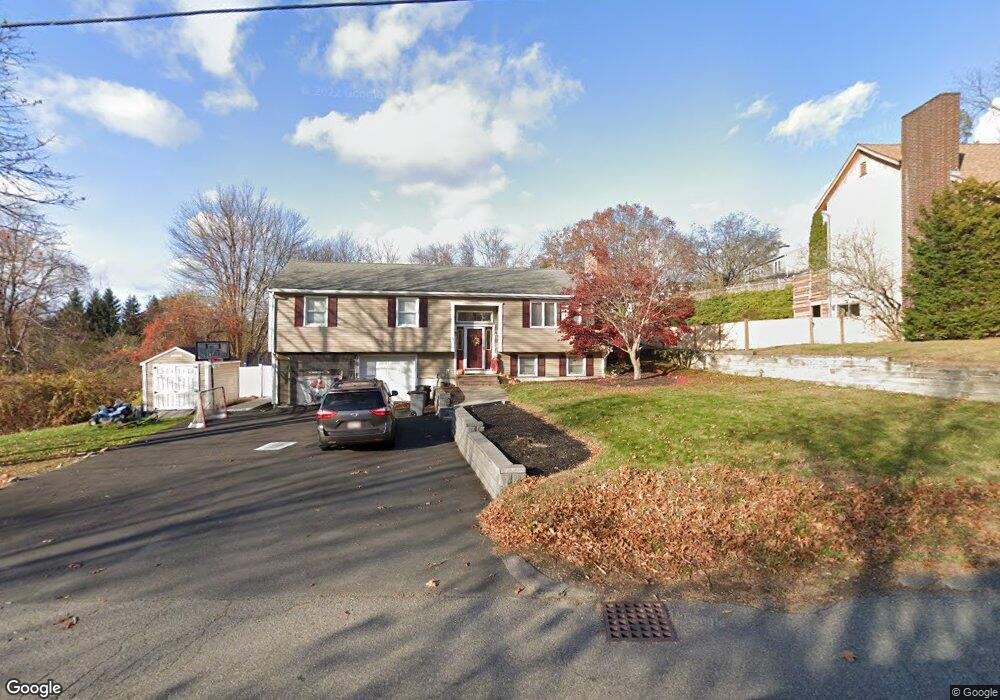
5 West St Danvers, MA 01923
Estimated Value: $946,139 - $1,125,000
4
Beds
3
Baths
2,592
Sq Ft
$394/Sq Ft
Est. Value
About This Home
This home is located at 5 West St, Danvers, MA 01923 and is currently estimated at $1,022,535, approximately $394 per square foot. 5 West St is a home located in Essex County with nearby schools including Danvers High School, St. Mary of the Annunciation School, and Plumfield Academy.
Ownership History
Date
Name
Owned For
Owner Type
Purchase Details
Closed on
Dec 30, 2010
Sold by
Scarfo Alfred and Scarfo Deborah
Bought by
Pinto Daniel and Pinto Kimberly
Current Estimated Value
Home Financials for this Owner
Home Financials are based on the most recent Mortgage that was taken out on this home.
Original Mortgage
$332,800
Interest Rate
4.37%
Mortgage Type
Purchase Money Mortgage
Purchase Details
Closed on
Dec 28, 1998
Sold by
Dorlando Karen A and Gallagher Karen A
Bought by
Scarfo Alfred and Scarfo Deborah
Create a Home Valuation Report for This Property
The Home Valuation Report is an in-depth analysis detailing your home's value as well as a comparison with similar homes in the area
Home Values in the Area
Average Home Value in this Area
Purchase History
| Date | Buyer | Sale Price | Title Company |
|---|---|---|---|
| Pinto Daniel | $416,000 | -- | |
| Scarfo Alfred | $270,000 | -- |
Source: Public Records
Mortgage History
| Date | Status | Borrower | Loan Amount |
|---|---|---|---|
| Open | Scarfo Alfred | $330,000 | |
| Closed | Scarfo Alfred | $332,800 |
Source: Public Records
Tax History Compared to Growth
Tax History
| Year | Tax Paid | Tax Assessment Tax Assessment Total Assessment is a certain percentage of the fair market value that is determined by local assessors to be the total taxable value of land and additions on the property. | Land | Improvement |
|---|---|---|---|---|
| 2025 | $9,155 | $833,000 | $423,400 | $409,600 |
| 2024 | $8,469 | $762,300 | $416,400 | $345,900 |
| 2023 | $8,318 | $707,900 | $381,100 | $326,800 |
| 2022 | $8,091 | $639,100 | $338,800 | $300,300 |
| 2021 | $8,475 | $634,800 | $334,500 | $300,300 |
| 2020 | $8,153 | $624,300 | $334,500 | $289,800 |
| 2019 | $7,879 | $593,300 | $303,500 | $289,800 |
| 2018 | $7,611 | $562,100 | $303,500 | $258,600 |
| 2017 | $7,113 | $501,300 | $261,100 | $240,200 |
| 2016 | $6,918 | $487,200 | $247,000 | $240,200 |
| 2015 | $6,708 | $449,900 | $225,800 | $224,100 |
Source: Public Records
Map
Nearby Homes
- 2 Pat Dr
- 360 Andover St Unit 1310
- 37 Peaslee Cir Unit 37
- 6 Greystone Dr
- 10 Oak St
- 8 Brookside Rd
- 1 Mills Point Unit 1
- 320 Newbury St Unit 304
- 98 Newbury St Unit 4B
- 98 Newbury St Unit 18B
- 103 Newbury St Unit 3
- 103 Newbury St Unit 1
- 19 Peachey Cir
- 5 Wennerberg Rd
- 4 Briarwood Dr
- 1 Willow St
- 96 Newbury St Unit 6B
- 67 Fuller Pond Rd
- 35 East St
- 47 Maple St Unit A