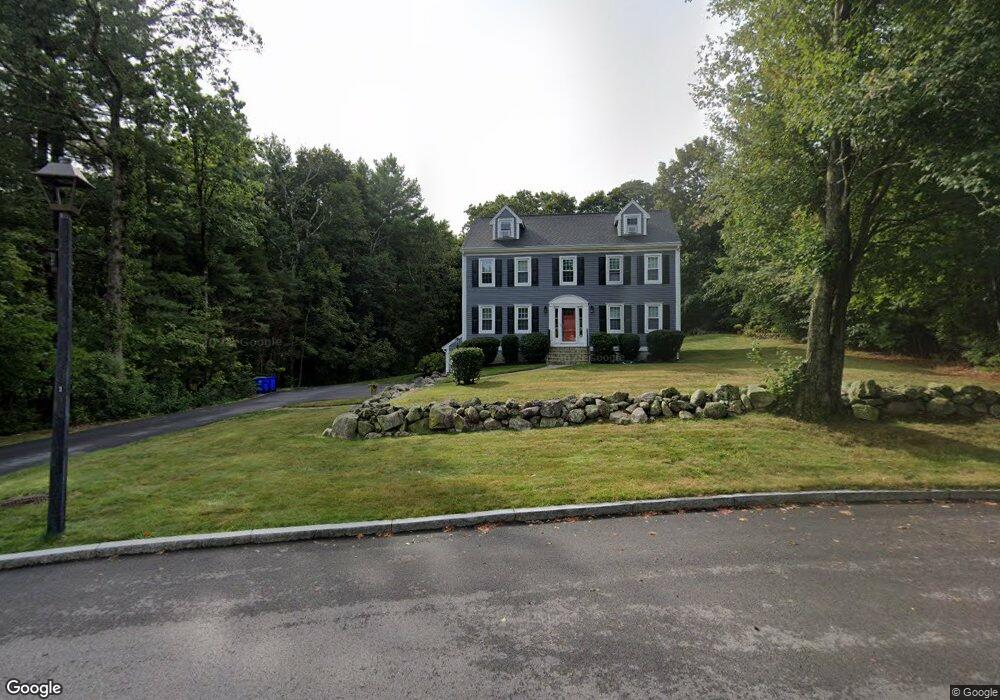
5 White Rd Rockland, MA 02370
Estimated Value: $780,362 - $940,000
3
Beds
3
Baths
2,722
Sq Ft
$306/Sq Ft
Est. Value
About This Home
This home is located at 5 White Rd, Rockland, MA 02370 and is currently estimated at $833,341, approximately $306 per square foot. 5 White Rd is a home located in Plymouth County with nearby schools including Rockland Senior High School, Calvary Chapel Academy, and Holy Family Elementary School.
Ownership History
Date
Name
Owned For
Owner Type
Purchase Details
Closed on
Jan 19, 2007
Sold by
Mcsweeny William F and Mcsweeny Sharon A
Bought by
Hennessy John and Hennessy Jaime
Current Estimated Value
Home Financials for this Owner
Home Financials are based on the most recent Mortgage that was taken out on this home.
Original Mortgage
$358,000
Interest Rate
6.14%
Mortgage Type
Purchase Money Mortgage
Create a Home Valuation Report for This Property
The Home Valuation Report is an in-depth analysis detailing your home's value as well as a comparison with similar homes in the area
Home Values in the Area
Average Home Value in this Area
Purchase History
| Date | Buyer | Sale Price | Title Company |
|---|---|---|---|
| Hennessy John | $447,500 | -- |
Source: Public Records
Mortgage History
| Date | Status | Borrower | Loan Amount |
|---|---|---|---|
| Open | Hennessy John | $345,000 | |
| Closed | Hennessy John | $358,000 | |
| Closed | Hennessy John | $44,750 | |
| Previous Owner | Hennessy John | $192,750 |
Source: Public Records
Tax History
| Year | Tax Paid | Tax Assessment Tax Assessment Total Assessment is a certain percentage of the fair market value that is determined by local assessors to be the total taxable value of land and additions on the property. | Land | Improvement |
|---|---|---|---|---|
| 2025 | $9,451 | $691,400 | $267,200 | $424,200 |
| 2024 | $9,250 | $657,900 | $252,100 | $405,800 |
| 2023 | $9,191 | $603,900 | $231,200 | $372,700 |
| 2022 | $8,790 | $524,800 | $201,000 | $323,800 |
| 2021 | $8,472 | $490,300 | $191,100 | $299,200 |
| 2020 | $0 | $467,100 | $182,000 | $285,100 |
| 2019 | $6,434 | $445,300 | $173,300 | $272,000 |
| 2018 | $6,722 | $442,500 | $195,900 | $246,600 |
| 2017 | $5,840 | $420,400 | $195,900 | $224,500 |
| 2016 | $7,479 | $404,500 | $188,400 | $216,100 |
| 2015 | $7,140 | $375,200 | $176,100 | $199,100 |
| 2014 | $6,747 | $367,900 | $172,600 | $195,300 |
Source: Public Records
Map
Nearby Homes
- 206-208 Hinghm St
- 14 Pleasant View Park
- 48 Bigelow Ave
- 63 Webster St
- 117 Liberty St
- 36 Bayberry Ln
- 40 Summit St
- 92 Liberty St
- 49 Liberty St
- 14 Dyer St Unit 14
- 12 Dyer St Unit 12
- 19 Dyer St Unit 19
- 737-739 Union St
- 21 Liberty Ct
- 7 Boxberry Ln Unit 7
- 738 Whiting St
- 9 Old Market St
- 12 Linden St
- 35-37 Salem St
- 103 Reed St
Your Personal Tour Guide
Ask me questions while you tour the home.