Estimated Value: $1,078,066 - $1,161,000
4
Beds
3
Baths
2,516
Sq Ft
$443/Sq Ft
Est. Value
About This Home
This home is located at 5 Wilson Ln, Acton, MA 01720 and is currently estimated at $1,114,767, approximately $443 per square foot. 5 Wilson Ln is a home located in Middlesex County with nearby schools including Acton-Boxborough Regional High School.
Ownership History
Date
Name
Owned For
Owner Type
Purchase Details
Closed on
Feb 26, 2009
Sold by
Carmasino Dana R
Bought by
Carmosino Dana R and Carmosino Karmel E
Current Estimated Value
Purchase Details
Closed on
Jul 27, 2007
Sold by
Verner Deborah D and Verner Jason C
Bought by
Carmasino Dana R and Carmasino Karmel E
Purchase Details
Closed on
Feb 14, 2003
Sold by
Amorello Christopher B and Amorello Susan S
Bought by
Verner Jason C and Verner Debroah D
Purchase Details
Closed on
Apr 28, 1995
Sold by
Petrocchi Pio J and Petrocchi Eleanor J
Bought by
Amorello Christopher and Amorello Susan B
Create a Home Valuation Report for This Property
The Home Valuation Report is an in-depth analysis detailing your home's value as well as a comparison with similar homes in the area
Home Values in the Area
Average Home Value in this Area
Purchase History
| Date | Buyer | Sale Price | Title Company |
|---|---|---|---|
| Carmosino Dana R | -- | -- | |
| Carmasino Dana R | $647,000 | -- | |
| Verner Jason C | $605,000 | -- | |
| Amorello Christopher | $304,000 | -- |
Source: Public Records
Mortgage History
| Date | Status | Borrower | Loan Amount |
|---|---|---|---|
| Open | Amorello Christopher | $310,000 | |
| Closed | Amorello Christopher | $30,000 |
Source: Public Records
Tax History
| Year | Tax Paid | Tax Assessment Tax Assessment Total Assessment is a certain percentage of the fair market value that is determined by local assessors to be the total taxable value of land and additions on the property. | Land | Improvement |
|---|---|---|---|---|
| 2025 | $17,153 | $1,000,200 | $370,500 | $629,700 |
| 2024 | $16,003 | $960,000 | $370,500 | $589,500 |
| 2023 | $15,620 | $889,500 | $337,000 | $552,500 |
| 2022 | $14,870 | $764,500 | $293,000 | $471,500 |
| 2021 | $14,521 | $717,800 | $271,300 | $446,500 |
| 2020 | $13,691 | $711,600 | $271,300 | $440,300 |
| 2019 | $11,260 | $581,300 | $271,300 | $310,000 |
| 2018 | $11,078 | $571,600 | $271,300 | $300,300 |
| 2017 | $10,958 | $574,900 | $271,300 | $303,600 |
| 2016 | $10,767 | $559,900 | $271,300 | $288,600 |
| 2015 | $10,371 | $544,400 | $271,300 | $273,100 |
| 2014 | $10,071 | $517,800 | $271,300 | $246,500 |
Source: Public Records
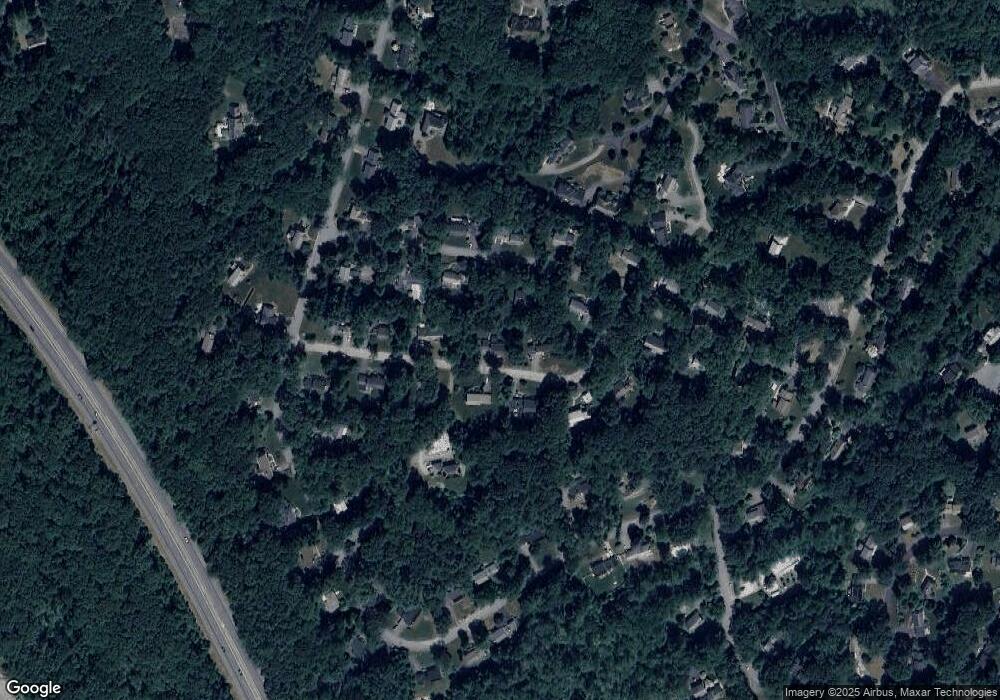
Map
Nearby Homes
Your Personal Tour Guide
Ask me questions while you tour the home.