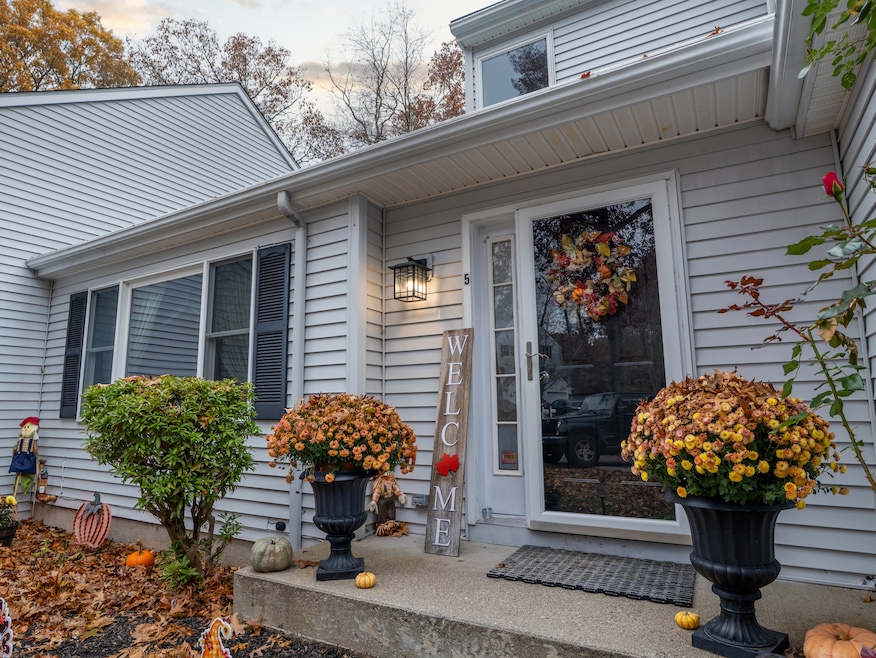
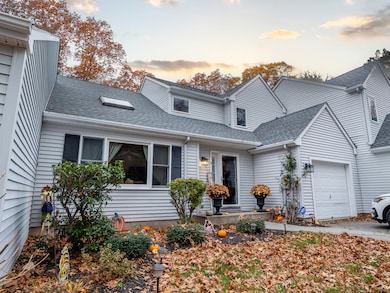
5 Windy Ridge Place Unit 5 Waterford, CT 06385
Estimated payment $2,378/month
Highlights
- Popular Property
- Colonial Architecture
- Cul-De-Sac
- Waterford High School Rated A-
- Cathedral Ceiling
- Hot Water Circulator
About This Home
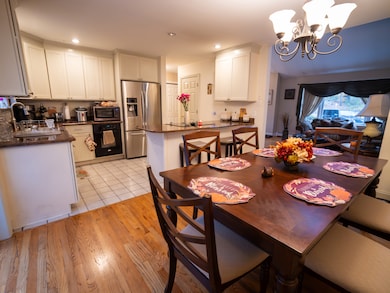
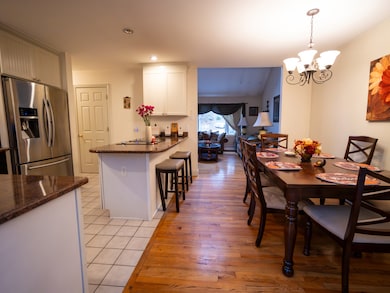
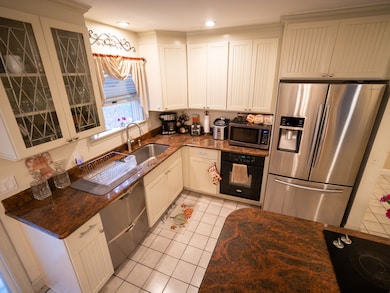
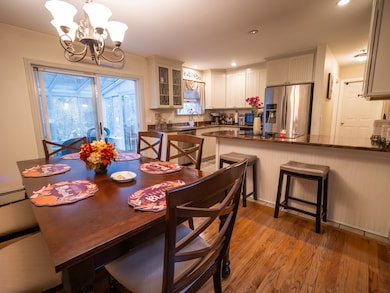
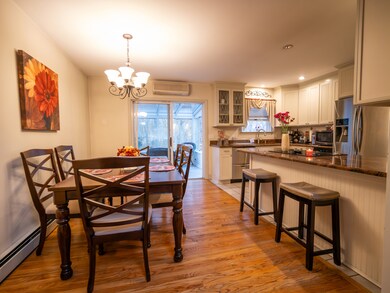
Desirable single-family attached home featuring cathedral ceilings, skylights, and hardwood floors. The first-floor primary bedroom offers convenience and ample closet space. Enjoy a center-island kitchen and a bright, open layout. 3 Season Room is a tranquil retreat. The walkout lower level includes a spacious family room, workshop, and office. Set in a beautifully maintained cul-de-sac community where the land is owned - not leased. Seller recently obtained a licensed appraisal valuing the property ABOVE the list price. Report available for review upon request.
Listing Agent
Making Connections Realty Brokerage Phone: (860) 803-4061 License #REB.0792796 Listed on: 11/07/2025
Open House Schedule
-
Sunday, December 07, 202512:00 to 2:00 pm12/7/2025 12:00:00 PM +00:0012/7/2025 2:00:00 PM +00:00Add to Calendar
Home Details
Home Type
- Single Family
Est. Annual Taxes
- $4,149
Year Built
- Built in 1995
Lot Details
- 6,970 Sq Ft Lot
- Cul-De-Sac
- Property is zoned R-20
HOA Fees
- $110 Monthly HOA Fees
Parking
- 1 Car Garage
Home Design
- Colonial Architecture
- Contemporary Architecture
- Concrete Foundation
- Frame Construction
- Asphalt Shingled Roof
- Vinyl Siding
Interior Spaces
- 1,649 Sq Ft Home
- Cathedral Ceiling
- Partially Finished Basement
- Basement Fills Entire Space Under The House
Kitchen
- Oven or Range
- Dishwasher
Bedrooms and Bathrooms
- 3 Bedrooms
- 2 Full Bathrooms
Utilities
- Baseboard Heating
- Hot Water Heating System
- Heating System Uses Oil
- Hot Water Circulator
- Fuel Tank Located in Basement
Community Details
- Association fees include snow removal, property management
- Planned Unit Development
Listing and Financial Details
- Assessor Parcel Number 1591138
Map
Home Values in the Area
Average Home Value in this Area
Tax History
| Year | Tax Paid | Tax Assessment Tax Assessment Total Assessment is a certain percentage of the fair market value that is determined by local assessors to be the total taxable value of land and additions on the property. | Land | Improvement |
|---|---|---|---|---|
| 2025 | $4,149 | $177,600 | $0 | $177,600 |
| 2024 | $3,960 | $177,600 | $0 | $177,600 |
| 2023 | $3,765 | $177,600 | $0 | $177,600 |
| 2022 | $3,985 | $144,600 | $0 | $144,600 |
| 2021 | $3,997 | $144,600 | $0 | $144,600 |
| 2020 | $4,030 | $144,600 | $0 | $144,600 |
| 2019 | $4,046 | $144,600 | $0 | $144,600 |
| 2018 | $3,965 | $144,600 | $0 | $144,600 |
| 2017 | $3,947 | $146,020 | $0 | $146,020 |
| 2016 | $3,910 | $146,020 | $0 | $146,020 |
| 2015 | $3,772 | $146,020 | $0 | $146,020 |
| 2014 | $3,621 | $146,020 | $0 | $146,020 |
Property History
| Date | Event | Price | List to Sale | Price per Sq Ft |
|---|---|---|---|---|
| 11/15/2025 11/15/25 | For Sale | $364,900 | -- | $221 / Sq Ft |
Purchase History
| Date | Type | Sale Price | Title Company |
|---|---|---|---|
| Warranty Deed | $231,000 | None Available | |
| Warranty Deed | $232,500 | -- | |
| Warranty Deed | $136,900 | -- |
Mortgage History
| Date | Status | Loan Amount | Loan Type |
|---|---|---|---|
| Open | $226,816 | FHA | |
| Previous Owner | $209,250 | Purchase Money Mortgage | |
| Previous Owner | $50,000 | No Value Available | |
| Previous Owner | $30,000 | No Value Available | |
| Previous Owner | $124,000 | No Value Available |
Source: SmartMLS
MLS Number: 24138354
APN: WATE-000119-000000-009281
Disclaimer: Certain information contained herein is derived from information provided by parties other than Homes.com. All information provided is deemed reliable, but is not guaranteed to be accurate and should be independently verified.
![]() IDX information is provided exclusively for personal, non-commercial use, and may not be used for any purpose other than to identify prospective properties consumers may be interested in purchasing. Information is deemed reliable but not guaranteed.
IDX information is provided exclusively for personal, non-commercial use, and may not be used for any purpose other than to identify prospective properties consumers may be interested in purchasing. Information is deemed reliable but not guaranteed.
- 68 Clark Ln
- 213 Boston Post Rd
- 226 Colman St
- 47 Phillips St
- 18 W Pleasant St
- 14 N Phillips St
- 385 Broad St
- 270 Boston Post Rd Unit 22
- 270 Boston Post Rd Unit TRLR 6
- 140 Waterford Pkwy S
- 68 Raymond St
- 35 Pine St
- 24 Pine St
- 54 Rope Ferry Rd Unit C55
- 54 Rope Ferry Rd Unit D72
- 54 Rope Ferry Rd Unit C45
- 77 Colman St
- 140 Norwood Ave
- 171 Norwood Ave
- 12 Pine St
- 5 Two Mile Hill Rd
- 8-127 Michael Rd
- 11 Anthony Rd
- 24 Savi Ave
- 105 Boston Post Rd
- 58 Georgiana St
- 20 Woodland Dr
- 12 Rogers St
- 12 Rogers St Unit 12 Rogers Street
- 78 West St Unit 2A
- 68 Connecticut Ave
- 912-914 Bank St Unit 2
- 94 Blackhall St
- 310 Boston Post Rd Unit 56
- 2 North Rd
- 34 Williams St
- 394 Willetts Ave
- 7 Prest St Unit 3
- 32 Channing St Unit 1
- 120 Broad St Unit 407
