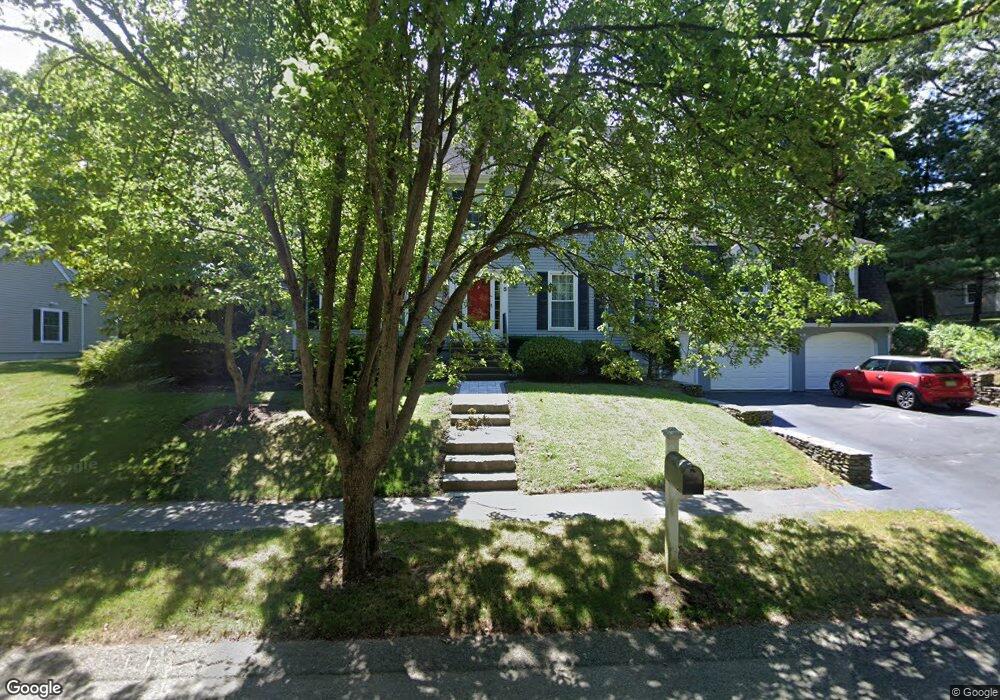
5 Woodbridge Rd Hingham, MA 02043
Estimated Value: $1,092,000 - $2,023,000
4
Beds
3
Baths
2,791
Sq Ft
$526/Sq Ft
Est. Value
About This Home
This home is located at 5 Woodbridge Rd, Hingham, MA 02043 and is currently estimated at $1,467,331, approximately $525 per square foot. 5 Woodbridge Rd is a home located in Plymouth County with nearby schools including Plymouth River Elementary School, Hingham Middle School, and Hingham High School.
Ownership History
Date
Name
Owned For
Owner Type
Purchase Details
Closed on
Aug 7, 2015
Sold by
Connors Realty Llc
Bought by
Paula A Connors Ret and Connors
Current Estimated Value
Purchase Details
Closed on
Sep 19, 2012
Sold by
Connors Matthew E and Connors Paula A
Bought by
Connors Realty Llc
Home Financials for this Owner
Home Financials are based on the most recent Mortgage that was taken out on this home.
Original Mortgage
$335,000
Interest Rate
3.52%
Mortgage Type
New Conventional
Purchase Details
Closed on
Sep 11, 2012
Sold by
Connors Realty Llc
Bought by
Connors Matthew E and Connors Paula A
Home Financials for this Owner
Home Financials are based on the most recent Mortgage that was taken out on this home.
Original Mortgage
$335,000
Interest Rate
3.52%
Mortgage Type
New Conventional
Purchase Details
Closed on
Aug 26, 2004
Sold by
Connors Matthew E and Connors Paula A
Bought by
Connors Realty Llc
Purchase Details
Closed on
Jun 22, 1995
Sold by
Harlow Albert M and Harlow Marilyn W
Bought by
Connors Matthew E and Connors Paula A
Purchase Details
Closed on
Jul 26, 1990
Sold by
Woodbridge Rt
Bought by
Harlow Albert M
Create a Home Valuation Report for This Property
The Home Valuation Report is an in-depth analysis detailing your home's value as well as a comparison with similar homes in the area
Purchase History
| Date | Buyer | Sale Price | Title Company |
|---|---|---|---|
| Paula A Connors Ret | -- | -- | |
| Connors Realty Llc | -- | -- | |
| Connors Matthew E | -- | -- | |
| Connors Realty Llc | -- | -- | |
| Connors Matthew E | $382,000 | -- | |
| Harlow Albert M | $350,000 | -- | |
| Harlow Albert M | $350,000 | -- |
Source: Public Records
Mortgage History
| Date | Status | Borrower | Loan Amount |
|---|---|---|---|
| Previous Owner | Connors Matthew E | $335,000 | |
| Previous Owner | Harlow Albert M | $295,700 | |
| Previous Owner | Harlow Albert M | $327,600 |
Source: Public Records
Tax History
| Year | Tax Paid | Tax Assessment Tax Assessment Total Assessment is a certain percentage of the fair market value that is determined by local assessors to be the total taxable value of land and additions on the property. | Land | Improvement |
|---|---|---|---|---|
| 2025 | $11,611 | $1,086,200 | $408,000 | $678,200 |
| 2024 | $11,133 | $1,026,100 | $408,000 | $618,100 |
| 2023 | $9,694 | $969,400 | $408,000 | $561,400 |
| 2022 | $9,273 | $802,200 | $352,000 | $450,200 |
| 2021 | $8,992 | $762,000 | $352,000 | $410,000 |
| 2020 | $5,309 | $762,000 | $352,000 | $410,000 |
| 2019 | $8,682 | $735,100 | $352,000 | $383,100 |
| 2018 | $8,652 | $735,100 | $352,000 | $383,100 |
| 2017 | $4,436 | $695,700 | $400,000 | $295,700 |
| 2016 | $8,452 | $676,700 | $381,000 | $295,700 |
| 2015 | $8,254 | $658,700 | $363,000 | $295,700 |
Source: Public Records
Map
Nearby Homes
- 7 Woodbridge Rd
- 3 Woodbridge Rd
- 1 Woodbridge Rd
- 10 Woodbridge Rd
- 2 Woodbridge Rd
- 24 Towerbrook Rd
- 22 Towerbrook Rd
- 26 Towerbrook Rd
- 12 Woodbridge Rd
- 20 Towerbrook Rd
- 22 Cross St
- 34 Cross St
- 28 Towerbrook Rd
- 32 Cross St
- 20 Cross St
- 14 Woodbridge Rd
- 18 Towerbrook Rd
- 7 Cross St
- 44 Cross St
- 21 Towerbrook Rd
Your Personal Tour Guide
Ask me questions while you tour the home.