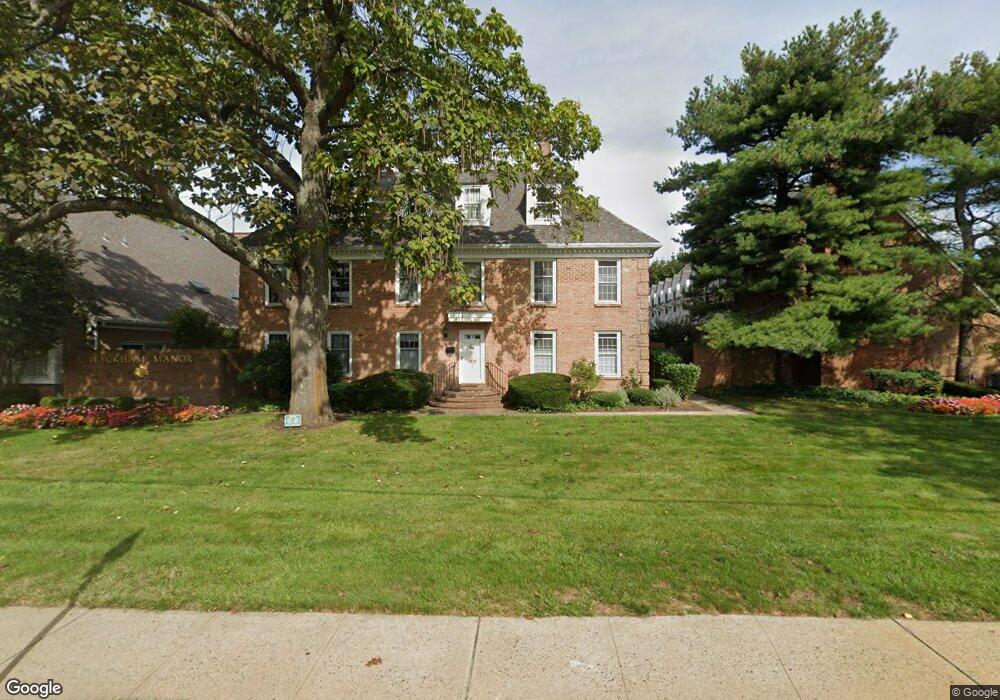
5 Wyckham Rd Spring Lake, NJ 07762
Estimated Value: $785,000 - $941,000
2
Beds
3
Baths
1,394
Sq Ft
$601/Sq Ft
Est. Value
About This Home
This home is located at 5 Wyckham Rd, Spring Lake, NJ 07762 and is currently estimated at $837,578, approximately $600 per square foot. 5 Wyckham Rd is a home located in Monmouth County with nearby schools including Spring Lake Heights Elementary School and St. Catharine School.
Ownership History
Date
Name
Owned For
Owner Type
Purchase Details
Closed on
Jul 13, 2020
Sold by
Hasbrouck Robert C and Hasbrouck Mary E
Bought by
Deluisola Amy M and Maurer Beth A
Current Estimated Value
Purchase Details
Closed on
Jun 22, 2000
Sold by
Joseph Florio
Bought by
Hasbrouck Robert and Hasbrouck Mary
Home Financials for this Owner
Home Financials are based on the most recent Mortgage that was taken out on this home.
Original Mortgage
$180,000
Interest Rate
8.48%
Mortgage Type
Purchase Money Mortgage
Purchase Details
Closed on
Jan 11, 1999
Sold by
Haith Richard
Bought by
Snow Robert and Snow Marianne
Home Financials for this Owner
Home Financials are based on the most recent Mortgage that was taken out on this home.
Original Mortgage
$75,000
Interest Rate
6.78%
Create a Home Valuation Report for This Property
The Home Valuation Report is an in-depth analysis detailing your home's value as well as a comparison with similar homes in the area
Home Values in the Area
Average Home Value in this Area
Purchase History
| Date | Buyer | Sale Price | Title Company |
|---|---|---|---|
| Deluisola Amy M | -- | None Available | |
| Hasbrouck Robert | $225,000 | -- | |
| Snow Robert | $175,000 | -- |
Source: Public Records
Mortgage History
| Date | Status | Borrower | Loan Amount |
|---|---|---|---|
| Previous Owner | Hasbrouck Robert | $180,000 | |
| Previous Owner | Snow Robert | $75,000 |
Source: Public Records
Tax History
| Year | Tax Paid | Tax Assessment Tax Assessment Total Assessment is a certain percentage of the fair market value that is determined by local assessors to be the total taxable value of land and additions on the property. | Land | Improvement |
|---|---|---|---|---|
| 2025 | $7,013 | $722,200 | $501,400 | $220,800 |
| 2024 | $5,631 | $666,000 | $451,400 | $214,600 |
| 2023 | $5,631 | $502,800 | $300,000 | $202,800 |
| 2022 | $5,712 | $441,400 | $240,000 | $201,400 |
| 2021 | $5,712 | $423,100 | $240,000 | $183,100 |
| 2020 | $5,519 | $406,400 | $240,000 | $166,400 |
| 2019 | $5,063 | $369,000 | $210,000 | $159,000 |
| 2018 | $5,072 | $359,700 | $210,000 | $149,700 |
| 2017 | $4,828 | $355,000 | $210,000 | $145,000 |
| 2016 | $4,876 | $354,100 | $210,000 | $144,100 |
| 2015 | $4,674 | $340,400 | $200,000 | $140,400 |
| 2014 | $4,189 | $311,900 | $160,000 | $151,900 |
Source: Public Records
Map
Nearby Homes
- 815 Woodcrest Dr
- 905 Woodcrest Dr
- 23 Locust Way
- 420 Ludlow Ave
- 16 Cherry Ct
- 809 Wall Rd
- 513 Mercer Ave
- 207 Tuttle Ave
- 2419 Kipling Ave
- 206 Brighton Ave
- 217 Pitney Ave
- 117 Madison Ave
- 2208 2nd Ave
- 604 Monmouth Ave
- 27 Apple Dr
- 1838 State Route 35 Unit 10
- 1813 World St
- 118 Warren Ave
- 2 Seawood Way
- 2009 Ocean Ave
Your Personal Tour Guide
Ask me questions while you tour the home.