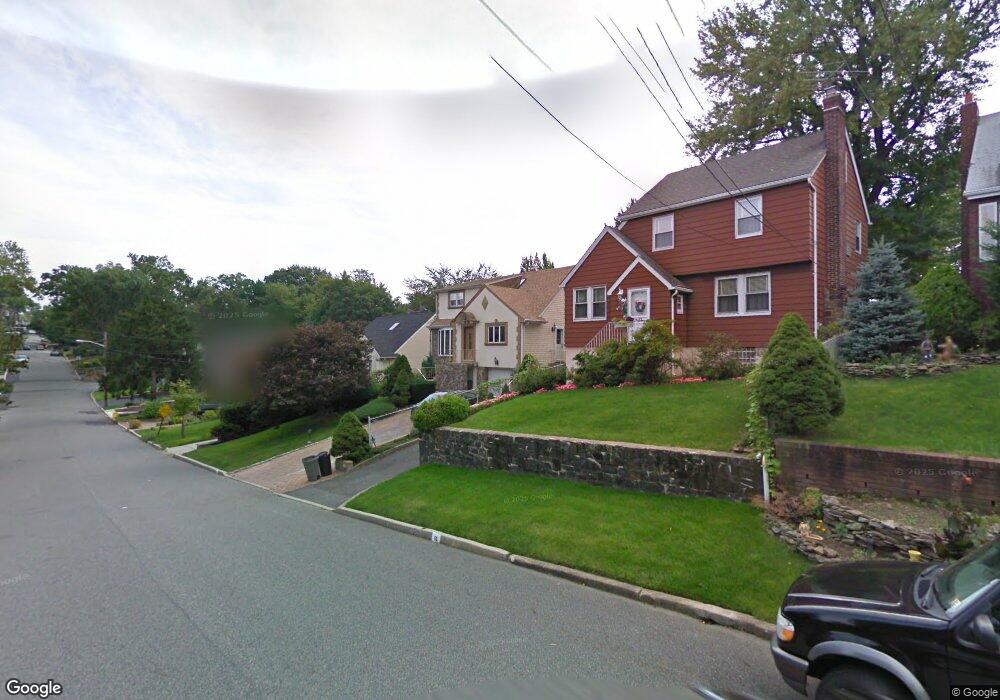
50 1/2 Irving Ave Englewood Cliffs, NJ 07632
Estimated Value: $1,128,000 - $1,306,000
--
Bed
--
Bath
1,861
Sq Ft
$646/Sq Ft
Est. Value
About This Home
This home is located at 50 1/2 Irving Ave, Englewood Cliffs, NJ 07632 and is currently estimated at $1,202,990, approximately $646 per square foot. 50 1/2 Irving Ave is a home located in Bergen County with nearby schools including North Cliff Elementary School, Upper School Elementary School, and Christ the Teacher Academy.
Ownership History
Date
Name
Owned For
Owner Type
Purchase Details
Closed on
Oct 12, 2016
Sold by
Bonks Eugene and Bonks Anna
Bought by
Bonks Eugene and Bonks Anna
Current Estimated Value
Home Financials for this Owner
Home Financials are based on the most recent Mortgage that was taken out on this home.
Original Mortgage
$421,190
Outstanding Balance
$343,629
Interest Rate
4.03%
Mortgage Type
New Conventional
Estimated Equity
$859,361
Purchase Details
Closed on
Sep 21, 2000
Bought by
Bonks Yevgeniy
Home Financials for this Owner
Home Financials are based on the most recent Mortgage that was taken out on this home.
Original Mortgage
$25,100
Interest Rate
7.78%
Purchase Details
Closed on
Sep 24, 1999
Sold by
Giusto Salvatore Anthony and Giusto June A
Bought by
Bonks Yevgeniy and Bonks Anna
Create a Home Valuation Report for This Property
The Home Valuation Report is an in-depth analysis detailing your home's value as well as a comparison with similar homes in the area
Home Values in the Area
Average Home Value in this Area
Purchase History
| Date | Buyer | Sale Price | Title Company |
|---|---|---|---|
| Bonks Eugene | -- | None Available | |
| Bonks Yevgeniy | -- | -- | |
| Bonks Yevgeniy | -- | -- | |
| Bonks Yevgeniy | $342,500 | -- |
Source: Public Records
Mortgage History
| Date | Status | Borrower | Loan Amount |
|---|---|---|---|
| Open | Bonks Eugene | $421,190 | |
| Previous Owner | Bonks Yevgeniy | $25,100 |
Source: Public Records
Tax History Compared to Growth
Tax History
| Year | Tax Paid | Tax Assessment Tax Assessment Total Assessment is a certain percentage of the fair market value that is determined by local assessors to be the total taxable value of land and additions on the property. | Land | Improvement |
|---|---|---|---|---|
| 2025 | $7,942 | $687,600 | $549,600 | $138,000 |
| 2024 | $7,846 | $687,600 | $549,600 | $138,000 |
| 2023 | $7,722 | $687,600 | $549,600 | $138,000 |
| 2022 | $7,722 | $687,600 | $549,600 | $138,000 |
| 2021 | $7,729 | $687,600 | $549,600 | $138,000 |
| 2020 | $7,914 | $687,600 | $549,600 | $138,000 |
| 2019 | $7,433 | $687,600 | $549,600 | $138,000 |
| 2018 | $7,172 | $687,600 | $549,600 | $138,000 |
| 2017 | $6,862 | $687,600 | $549,600 | $138,000 |
| 2016 | $6,732 | $687,600 | $549,600 | $138,000 |
| 2015 | $6,395 | $687,600 | $549,600 | $138,000 |
| 2014 | $5,982 | $687,600 | $549,600 | $138,000 |
Source: Public Records
Map
Nearby Homes
- 2460 1st St
- 12 Summit St
- 51 Anderson Ave
- 505 Adele Ct
- 422 Myrtle Ave
- 424 Myrtle Ave
- 2455 3rd St
- 66 Elm St
- 2446 3rd St
- 485 Westview Place
- 470 Myrtle Ave
- 2410 3rd St
- 54 Van Nostrand Ave
- 2345 Linwood Ave Unit 4H
- 2345 Linwood Ave Unit LG
- 2350 Linwood Ave Unit 5C
- 184 Jenkins Dr
- 400 Fairview Ave Unit 1H
- 2445 6th St
- 420 Fairview Ave Unit 4F