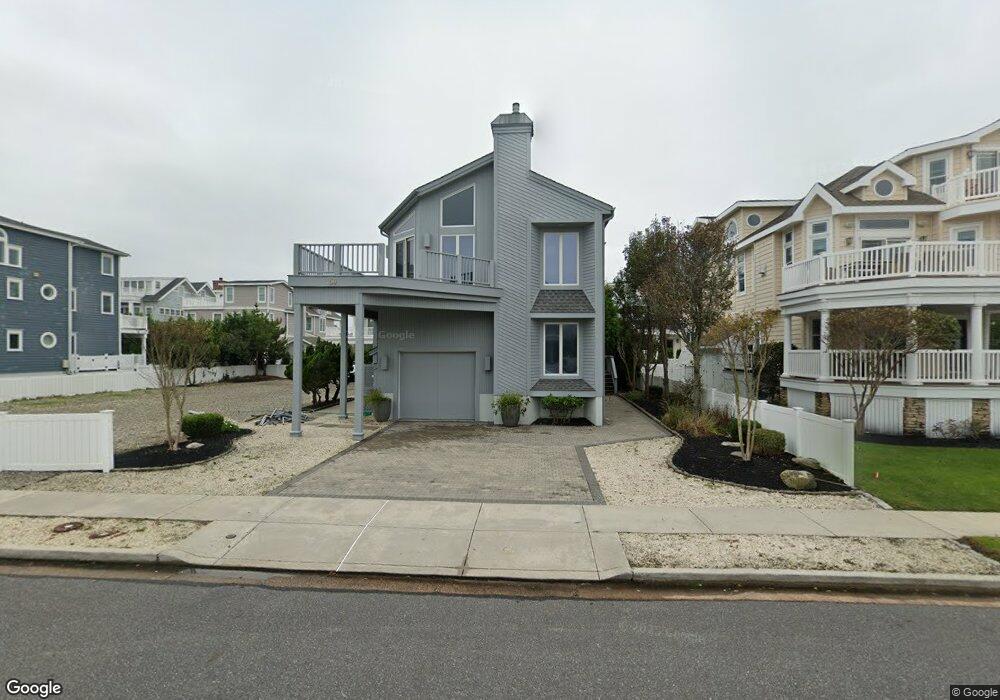
50 13th St E Avalon, NJ 08202
Estimated Value: $3,609,000 - $5,218,000
Studio
--
Bath
2,464
Sq Ft
$1,817/Sq Ft
Est. Value
About This Home
This home is located at 50 13th St E, Avalon, NJ 08202 and is currently estimated at $4,478,000, approximately $1,817 per square foot. 50 13th St E is a home located in Cape May County with nearby schools including Avalon Elementary School.
Ownership History
Date
Name
Owned For
Owner Type
Purchase Details
Closed on
Sep 24, 2012
Sold by
Preston Seymoyr S
Bought by
Seymour S Preston Iii Revocable Deed Of
Current Estimated Value
Purchase Details
Closed on
Sep 16, 2005
Sold by
Preston Seymour S and Preston Jean H
Bought by
Preston Seymour S
Purchase Details
Closed on
Sep 15, 2005
Sold by
Preston Seymour S
Bought by
Preston Seymour S and Preston Jean H
Create a Home Valuation Report for This Property
The Home Valuation Report is an in-depth analysis detailing your home's value as well as a comparison with similar homes in the area
Home Values in the Area
Average Home Value in this Area
Purchase History
| Date | Buyer | Sale Price | Title Company |
|---|---|---|---|
| Seymour S Preston Iii Revocable Deed Of | -- | None Available | |
| Preston Seymour S | -- | Title Source Inc | |
| Preston Seymour S | -- | -- |
Source: Public Records
Tax History
| Year | Tax Paid | Tax Assessment Tax Assessment Total Assessment is a certain percentage of the fair market value that is determined by local assessors to be the total taxable value of land and additions on the property. | Land | Improvement |
|---|---|---|---|---|
| 2025 | $15,182 | $2,472,700 | $1,700,000 | $772,700 |
| 2024 | $15,182 | $2,472,700 | $1,700,000 | $772,700 |
| 2023 | $15,059 | $2,472,700 | $1,700,000 | $772,700 |
| 2022 | $14,045 | $2,472,700 | $1,700,000 | $772,700 |
| 2021 | $12,611 | $2,472,700 | $1,700,000 | $772,700 |
| 2020 | $13,006 | $2,472,700 | $1,700,000 | $772,700 |
| 2019 | $12,611 | $2,472,700 | $1,700,000 | $772,700 |
| 2018 | $12,067 | $2,472,700 | $1,700,000 | $772,700 |
| 2017 | $11,704 | $2,105,000 | $1,400,000 | $705,000 |
| 2016 | $11,578 | $2,105,000 | $1,400,000 | $705,000 |
| 2015 | $11,388 | $2,105,000 | $1,400,000 | $705,000 |
| 2014 | $11,262 | $2,105,000 | $1,400,000 | $705,000 |
Source: Public Records
Map
Nearby Homes
Your Personal Tour Guide
Ask me questions while you tour the home.